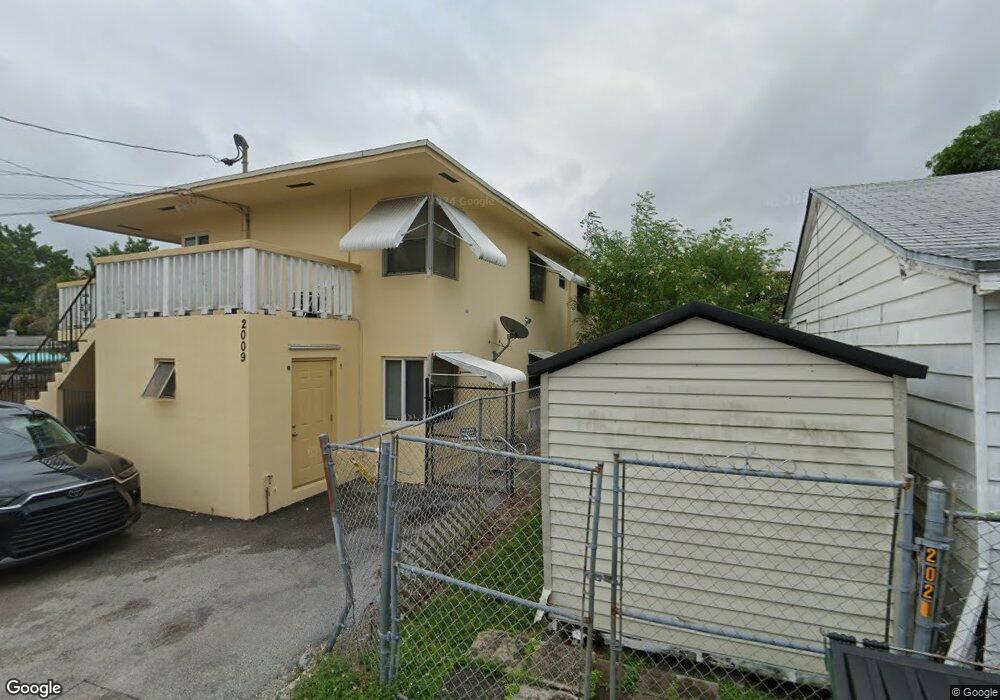
2009 Fillmore St Hollywood, FL 33020
Royal Poinciana NeighborhoodEstimated Value: $678,000 - $994,000
--
Bed
--
Bath
4,140
Sq Ft
$190/Sq Ft
Est. Value
About This Home
This home is located at 2009 Fillmore St, Hollywood, FL 33020 and is currently estimated at $787,331, approximately $190 per square foot. 2009 Fillmore St is a home located in Broward County with nearby schools including Dania Elementary School, Olsen Middle School, and South Broward High School.
Ownership History
Date
Name
Owned For
Owner Type
Purchase Details
Closed on
Aug 28, 2024
Sold by
Buhagiar Noel
Bought by
Buhagiar Noel and Buhagiar Destiny Shelik
Current Estimated Value
Purchase Details
Closed on
Nov 14, 2017
Sold by
Dejesus Rita
Bought by
Buhagiar Noel
Purchase Details
Closed on
Dec 17, 2010
Sold by
Buhajiar Noel
Bought by
Dejesus Rita
Purchase Details
Closed on
Oct 21, 2004
Sold by
Frederick Mark
Bought by
Buhajiar Noel
Home Financials for this Owner
Home Financials are based on the most recent Mortgage that was taken out on this home.
Original Mortgage
$320,000
Interest Rate
5.77%
Mortgage Type
Commercial
Purchase Details
Closed on
Sep 23, 1994
Sold by
Ackermann Frederick M and Ackermann Paula M
Bought by
Frederick Mark
Purchase Details
Closed on
Nov 1, 1980
Sold by
Available Not
Bought by
Available Not
Create a Home Valuation Report for This Property
The Home Valuation Report is an in-depth analysis detailing your home's value as well as a comparison with similar homes in the area
Home Values in the Area
Average Home Value in this Area
Purchase History
| Date | Buyer | Sale Price | Title Company |
|---|---|---|---|
| Buhagiar Noel | -- | None Listed On Document | |
| Buhagiar Noel | -- | Attorney | |
| Dejesus Rita | $189,500 | Empire Title Services Inc | |
| Buhajiar Noel | $400,000 | Summit Title & Settlement Se | |
| Frederick Mark | $162,000 | -- | |
| Available Not | $88,571 | -- |
Source: Public Records
Mortgage History
| Date | Status | Borrower | Loan Amount |
|---|---|---|---|
| Previous Owner | Buhajiar Noel | $320,000 |
Source: Public Records
Tax History Compared to Growth
Tax History
| Year | Tax Paid | Tax Assessment Tax Assessment Total Assessment is a certain percentage of the fair market value that is determined by local assessors to be the total taxable value of land and additions on the property. | Land | Improvement |
|---|---|---|---|---|
| 2025 | $12,966 | $569,760 | $49,090 | $520,670 |
| 2024 | $12,872 | $549,950 | $49,090 | $500,860 |
| 2023 | $12,872 | $543,410 | $0 | $0 |
| 2022 | $11,744 | $494,010 | $0 | $0 |
| 2021 | $10,667 | $449,100 | $49,090 | $400,010 |
| 2020 | $10,645 | $449,100 | $49,090 | $400,010 |
| 2019 | $10,472 | $449,100 | $49,090 | $400,010 |
| 2018 | $9,291 | $387,870 | $49,090 | $338,780 |
| 2017 | $7,035 | $269,200 | $0 | $0 |
| 2016 | $6,518 | $244,730 | $0 | $0 |
| 2015 | $5,928 | $222,490 | $0 | $0 |
| 2014 | $5,517 | $202,270 | $0 | $0 |
| 2013 | -- | $205,260 | $49,090 | $156,170 |
Source: Public Records
Map
Nearby Homes
- 2010 Fillmore St Unit 303
- 2010 Fillmore St Unit 202
- 504 N 20th Ave
- 1930 Pierce St
- 2000 Polk St
- 2145 Pierce St Unit 218
- 2145 Pierce St Unit 421
- 2145 Pierce St Unit 305
- 2145 Pierce St Unit 320
- 2145 Pierce St Unit 118
- 2145 Pierce St Unit 113
- 2145 Pierce St Unit 122
- 2145 Pierce St Unit 101
- 2145 Pierce St Unit 403
- 2145 Pierce St Unit 326
- 2145 Pierce St Unit 105
- 2145 Pierce St Unit 418
- 2145 Pierce St Unit 102
- 2145 Pierce St Unit 422
- 2206 Fillmore St 10 Units
- 520 N 20th Ave Unit N
- 520 N 20th Ave
- 2021 Fillmore St
- 2025 Fillmore St Unit 1-2
- 2025 Fillmore St Unit REAR
- 2025 Fillmore St
- 2037 Fillmore St
- 530 N 20th Ave Unit 2
- 530 N 20th Ave Unit 6
- 530 N 20th Ave Unit 10
- 530 N 20th Ave
- 2016 Pierce St Unit 2
- 2016 Pierce St Unit 1
- 2016 Pierce St
- 2010 Fillmore St Unit 408
- 2010 Fillmore St Unit 307
- 2010 Fillmore St Unit 209
- 2010 Fillmore St Unit 405
- 2010 Fillmore St Unit 302
- 2010 Fillmore St Unit 406