Estimated Value: $88,198 - $163,000
--
Bed
--
Bath
924
Sq Ft
$150/Sq Ft
Est. Value
About This Home
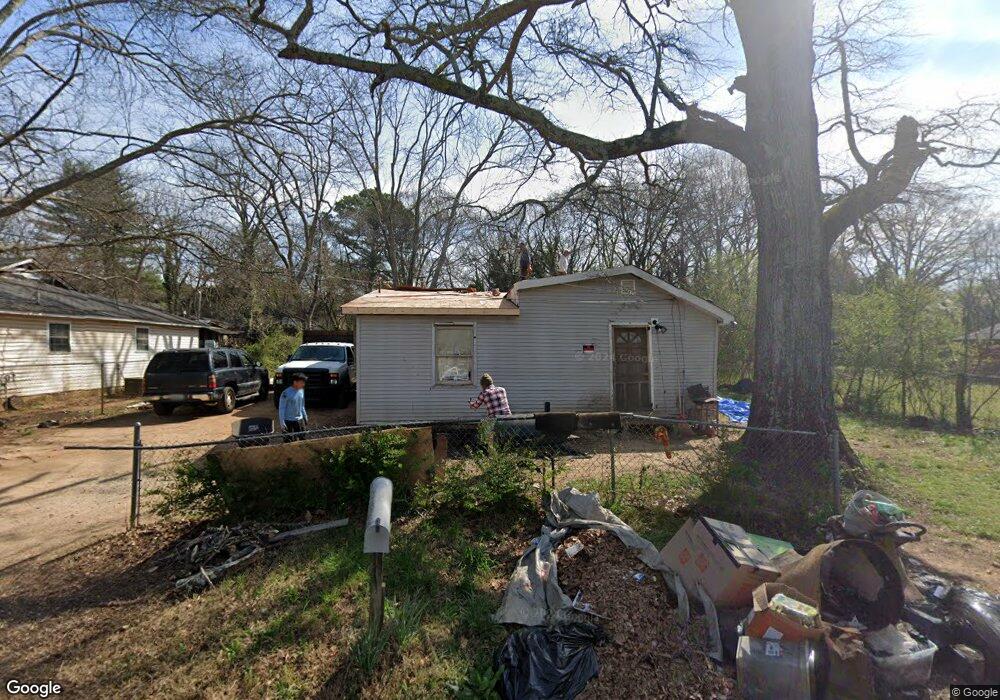
This home is located at 2009 Flannery St SW, Rome, GA 30161 and is currently estimated at $139,050, approximately $150 per square foot. 2009 Flannery St SW is a home located in Floyd County with nearby schools including Dan McCarty Middle School, Rome High School, and Montessori School of Rome.
Ownership History
Date
Name
Owned For
Owner Type
Purchase Details
Closed on
Nov 4, 2004
Sold by
Thornton Carmen
Bought by
Tant Mark Anthony and Tant Eric D
Current Estimated Value
Purchase Details
Closed on
Jul 18, 1994
Sold by
Jones Horace and Charles Smith
Bought by
Thornton Carmen
Purchase Details
Closed on
Mar 18, 1994
Sold by
Edwards Jerrie and Janice Wade
Bought by
Jones Horace and Charles Smith
Purchase Details
Closed on
Jan 14, 1994
Sold by
Brand Pauline
Bought by
Edwards Jerrie and Janice Wade
Purchase Details
Closed on
Mar 20, 1989
Sold by
Tanner Lenard Tanner Lenard Tanner Le
Bought by
Brand Pauline
Purchase Details
Closed on
Aug 28, 1975
Sold by
Andrew Olivia J
Bought by
Tanner Lenard Tanner Lenard Tanner
Purchase Details
Closed on
Dec 6, 1962
Sold by
Ely Meardia Monroe Ely Meardia Mon
Bought by
Andrew Olivia J
Purchase Details
Closed on
Jul 26, 1957
Bought by
Ely Meardia Monroe Ely Meardia Mon
Create a Home Valuation Report for This Property
The Home Valuation Report is an in-depth analysis detailing your home's value as well as a comparison with similar homes in the area
Home Values in the Area
Average Home Value in this Area
Purchase History
| Date | Buyer | Sale Price | Title Company |
|---|---|---|---|
| Tant Mark Anthony | $15,000 | -- | |
| Thornton Carmen | $25,500 | -- | |
| Jones Horace | $10,000 | -- | |
| Edwards Jerrie | -- | -- | |
| Brand Pauline | -- | -- | |
| Tanner Lenard Tanner Lenard Tanner | $5,300 | -- | |
| Andrew Olivia J | -- | -- | |
| Ely Meardia Monroe Ely Meardia Mon | -- | -- |
Source: Public Records
Tax History Compared to Growth
Tax History
| Year | Tax Paid | Tax Assessment Tax Assessment Total Assessment is a certain percentage of the fair market value that is determined by local assessors to be the total taxable value of land and additions on the property. | Land | Improvement |
|---|---|---|---|---|
| 2024 | $829 | $20,347 | $4,435 | $15,912 |
| 2023 | $721 | $18,594 | $4,032 | $14,562 |
| 2022 | $551 | $15,096 | $3,226 | $11,870 |
| 2021 | $499 | $13,451 | $3,226 | $10,225 |
| 2020 | $452 | $12,092 | $2,520 | $9,572 |
| 2019 | $422 | $11,390 | $2,520 | $8,870 |
| 2018 | $397 | $10,721 | $2,520 | $8,201 |
| 2017 | $382 | $10,330 | $2,520 | $7,810 |
| 2016 | $372 | $10,020 | $2,520 | $7,500 |
| 2015 | -- | $10,020 | $2,520 | $7,500 |
| 2014 | -- | $10,020 | $2,520 | $7,500 |
Source: Public Records
Map
Nearby Homes
- 111 Hosea St SW
- 14 Clover St SW
- 2014 Maple Ave SW
- 7 Willingham St SW
- 1705 Olmstead St SW
- 304 E 19th St SW
- 2108 Maple Ave SW
- 414 E 17th St SW
- 000 E Oglethorpe Hwy
- 1901 Hull Ave SW
- 1502 Spring Creek St SW
- 39 E 16th St SW
- 4 E 15th St SW
- 107 E Linden St SE
- 2512 Callier Springs Rd SE
- 2107 Rockmart Rd SE
- 0 Martha Berry Hwy Unit 7525627
- 0 Martha Berry Hwy Unit 7614774
- 0 Martha Berry Hwy Unit 10563404
- 1314 E 2nd Ave SE
- 2011 Flannery St SW
- 2007 Flannery St SW
- 112 Hosea St SW
- 2013 Flannery St SW
- 2005 Flannery St SW
- 110 Hosea St SW
- 114 Hosea St SW
- 28 Clover St SW
- 116 Hosea St SW
- 108 Hosea St SW
- 2015 Flannery St SW
- 2006 Flannery St SW
- 118 Hosea St SW
- 106 Hosea St SW
- 27 Clover St SW
- 2004 Flannery St SW
- 2004 Flannery St SW
- 2012 Flannery St SW
- 2003 Flannery St SW
- 26 Clover St SW