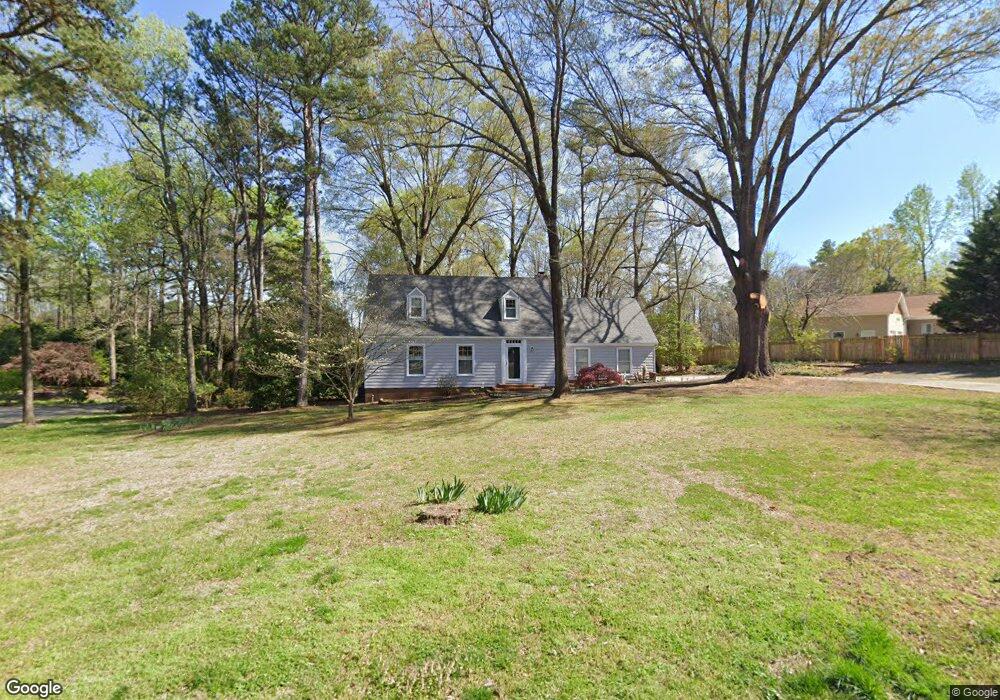
2009 Forest Hills Ln Monroe, NC 28112
Estimated Value: $341,959 - $360,000
3
Beds
3
Baths
1,748
Sq Ft
$202/Sq Ft
Est. Value
About This Home
This home is located at 2009 Forest Hills Ln, Monroe, NC 28112 and is currently estimated at $352,740, approximately $201 per square foot. 2009 Forest Hills Ln is a home located in Union County with nearby schools including Walter Bickett Elementary School, Monroe Middle School, and Monroe High School.
Ownership History
Date
Name
Owned For
Owner Type
Purchase Details
Closed on
Aug 30, 2018
Sold by
Dalrymple Edward H and Dalrymple Terri D
Bought by
Cassem Ardy L and Cassem Margaret E
Current Estimated Value
Purchase Details
Closed on
Aug 26, 2014
Sold by
Brueck Richard Samuel and Brueck Kate Hall
Bought by
Dalrymple Edward H and Dalrymple Terri D
Home Financials for this Owner
Home Financials are based on the most recent Mortgage that was taken out on this home.
Original Mortgage
$130,000
Interest Rate
4.19%
Mortgage Type
New Conventional
Purchase Details
Closed on
Apr 30, 2012
Sold by
Queen John C and Queen Nancy W
Bought by
Brueck Richard Samuel and Brueck Kate Hall
Home Financials for this Owner
Home Financials are based on the most recent Mortgage that was taken out on this home.
Original Mortgage
$112,084
Interest Rate
3.87%
Mortgage Type
FHA
Create a Home Valuation Report for This Property
The Home Valuation Report is an in-depth analysis detailing your home's value as well as a comparison with similar homes in the area
Home Values in the Area
Average Home Value in this Area
Purchase History
| Date | Buyer | Sale Price | Title Company |
|---|---|---|---|
| Cassem Ardy L | $195,000 | None Available | |
| Dalrymple Edward H | $144,500 | None Available | |
| Brueck Richard Samuel | $115,000 | None Available |
Source: Public Records
Mortgage History
| Date | Status | Borrower | Loan Amount |
|---|---|---|---|
| Previous Owner | Dalrymple Edward H | $130,000 | |
| Previous Owner | Brueck Richard Samuel | $112,084 |
Source: Public Records
Tax History Compared to Growth
Tax History
| Year | Tax Paid | Tax Assessment Tax Assessment Total Assessment is a certain percentage of the fair market value that is determined by local assessors to be the total taxable value of land and additions on the property. | Land | Improvement |
|---|---|---|---|---|
| 2024 | $1,950 | $178,800 | $27,800 | $151,000 |
| 2023 | $1,950 | $178,800 | $27,800 | $151,000 |
| 2022 | $1,950 | $178,800 | $27,800 | $151,000 |
| 2021 | $1,950 | $178,800 | $27,800 | $151,000 |
| 2020 | $1,644 | $122,000 | $20,900 | $101,100 |
| 2019 | $1,644 | $122,000 | $20,900 | $101,100 |
| 2018 | $752 | $121,950 | $20,850 | $101,100 |
| 2017 | $1,668 | $122,000 | $20,900 | $101,100 |
| 2016 | $1,650 | $121,950 | $20,850 | $101,100 |
| 2015 | $947 | $121,950 | $20,850 | $101,100 |
| 2014 | $1,887 | $154,680 | $17,980 | $136,700 |
Source: Public Records
Map
Nearby Homes
- 2105 Timber Ridge Rd
- 620 Hunley St
- 0 Avery Parker Rd
- 100 Forest Hills Dr
- 0 Lancaster Hwy
- 1302 Kensington Place
- 2213 Wheaton Way
- 2014 Pleasant Knoll Ln
- 901 Cameron Ct
- 211 Ridgewood Dr
- 00 Doster Rd
- 1003 Oak Hill Dr Unit 24
- 2128 Gambrel Way
- 2622 Lancaster Hwy
- 803 Southridge Dr
- 1315 Secrest Commons Dr
- 1311 Secrest Commons Dr
- Robie Plan at Secrest Commons
- Hayden Plan at Secrest Commons
- Wilmington Plan at Secrest Commons
- 2011 Timber Ridge Rd
- 2007 Forest Hills Ln
- 2101 Timber Ridge Rd
- 2004 Waverly Dr
- 2006 Forest Hills Ln
- 2008 Forest Hills Ln
- 2002 Waverly Dr
- 2005 Forest Hills Ln
- 2006 Waverly Dr
- 2100 Waverly Dr
- 2100 Timber Ridge Rd
- 1912 Waverly Dr
- 2010 Barkley Cir
- 2003 Forest Hills Ln
- 2102 Timber Ridge Rd
- 2455 Waverly Dr
- 2501 Waverly Dr
- 2115 Arden Dr
- 2107 Timber Ridge Rd
- 1907 Waverly Dr