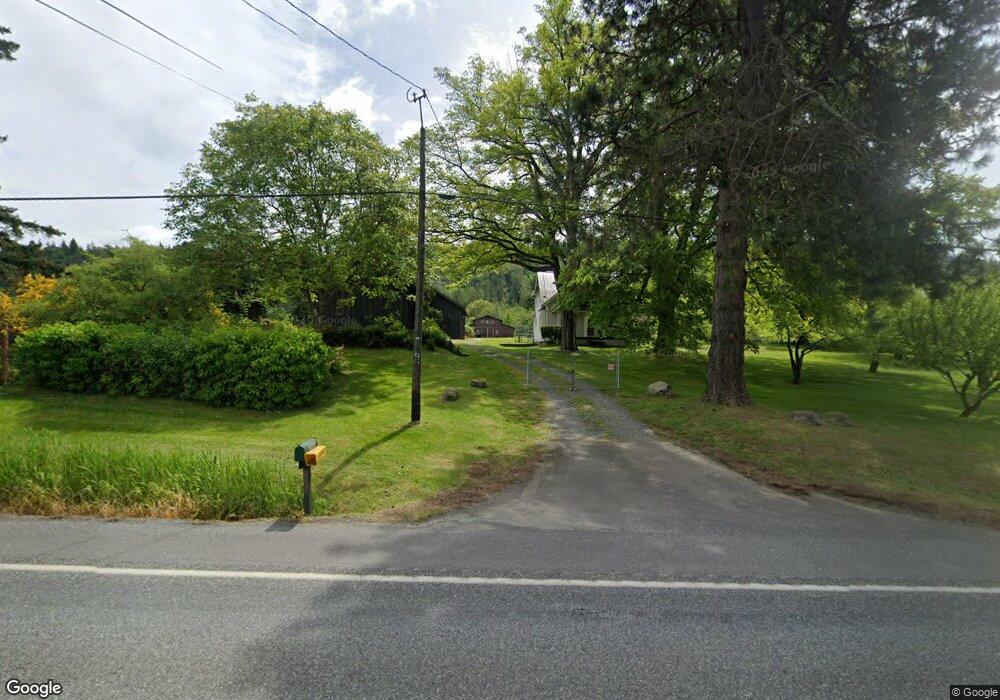
2009 Mt Baker Hwy Bellingham, WA 98226
Estimated Value: $659,000 - $748,489
3
Beds
1
Bath
1,488
Sq Ft
$463/Sq Ft
Est. Value
About This Home
This home is located at 2009 Mt Baker Hwy, Bellingham, WA 98226 and is currently estimated at $689,372, approximately $463 per square foot. 2009 Mt Baker Hwy is a home located in Whatcom County with nearby schools including Mount Baker Senior High School and Bellingham Christian School.
Ownership History
Date
Name
Owned For
Owner Type
Purchase Details
Closed on
Jun 24, 2025
Sold by
Owens-Llewellyn Delinda Carol and Lewellen Norman Ray
Bought by
Lewellen Norman Ray
Current Estimated Value
Purchase Details
Closed on
Oct 10, 2008
Sold by
Owens Virginia Bell D
Bought by
Owens Llewellyn Delinda C
Create a Home Valuation Report for This Property
The Home Valuation Report is an in-depth analysis detailing your home's value as well as a comparison with similar homes in the area
Home Values in the Area
Average Home Value in this Area
Purchase History
| Date | Buyer | Sale Price | Title Company |
|---|---|---|---|
| Lewellen Norman Ray | $313 | None Listed On Document | |
| Owens Llewellyn Delinda C | -- | None Available |
Source: Public Records
Tax History Compared to Growth
Tax History
| Year | Tax Paid | Tax Assessment Tax Assessment Total Assessment is a certain percentage of the fair market value that is determined by local assessors to be the total taxable value of land and additions on the property. | Land | Improvement |
|---|---|---|---|---|
| 2024 | $1,634 | $689,811 | $368,045 | $321,766 |
| 2023 | $1,634 | $674,321 | $359,780 | $314,541 |
| 2022 | $1,491 | $530,961 | $283,291 | $131,858 |
| 2021 | $1,524 | $438,811 | $234,125 | $131,858 |
| 2020 | $1,508 | $412,454 | $215,643 | $196,811 |
| 2019 | $1,348 | $376,670 | $196,934 | $179,736 |
| 2018 | $1,530 | $329,113 | $172,070 | $157,043 |
| 2017 | $1,461 | $303,967 | $158,923 | $145,044 |
| 2016 | $3,341 | $289,044 | $151,121 | $137,923 |
| 2015 | $2,715 | $276,333 | $144,475 | $131,858 |
| 2014 | -- | $216,991 | $133,452 | $83,539 |
| 2013 | -- | $220,843 | $135,807 | $85,036 |
Source: Public Records
Map
Nearby Homes
- 4455 E 18th Crest
- 1758 Emerald Lake Way
- 1 XXX Sleepy Hollow Ln
- 1668 Sapphire Trail
- 4220 Brays Way
- 0 xxxx Kelly Rd
- 1756 Emerald Lake Way
- 1812 Squalicum Mountain Rd
- 4136 Malachite Dr
- 4121 Malachite Dr
- 1445 Mt Baker Hwy
- 20 Academy Highlands
- 3827 Keystone Way
- 8 Academy Highlands Dr
- 11 Academy Highlands Dr
- 4204 Squalicum Lake Rd
- 3871 Cindy Ln
- 0 van Wyck Ln
- 1368 Roma Rd
- 2571 E Smith Rd
- 2045 Mt Baker Hwy
- 2026 Mt Baker Hwy
- 2016 Mt Baker Hwy
- 2054 Mt Baker Hwy
- 1946 Mt Baker Hwy
- 2073 Mt Baker Hwy
- 1966 Mt Baker Hwy
- 2084 Mt Baker Hwy
- 1942 Mt Baker Hwy
- 19 Mt Baker Hwy
- 2030 Mt Baker Hwy
- 4400 Saddlestone Dr
- 2098 Mt Baker Hwy
- 1950 Mt Baker Hwy
- 1916 Mt Baker Hwy
- 1904 Mt Baker Hwy
- 2103 Mt Baker Hwy
- 4550 Totem Trail
- 1905 Mount Baker Hwy