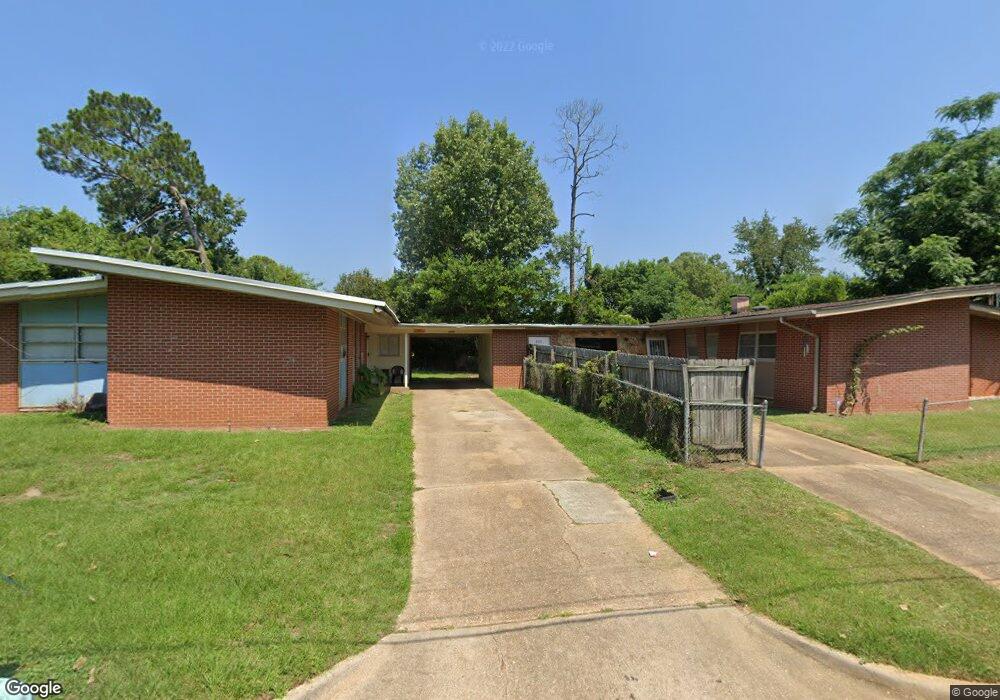
2009 N Skylane Dr Albany, GA 31705
Estimated Value: $51,000 - $65,319
3
Beds
2
Baths
1,394
Sq Ft
$43/Sq Ft
Est. Value
About This Home
This home is located at 2009 N Skylane Dr, Albany, GA 31705 and is currently estimated at $60,080, approximately $43 per square foot. 2009 N Skylane Dr is a home located in Dougherty County with nearby schools including Turner Elementary School, Albany Middle School, and Dougherty Comprehensive High School.
Ownership History
Date
Name
Owned For
Owner Type
Purchase Details
Closed on
Jun 1, 2020
Sold by
Jenha Properties Llc
Bought by
Palmer Donnie
Current Estimated Value
Purchase Details
Closed on
Mar 27, 2003
Sold by
Leveson Harris
Bought by
Jenha Properties Llc
Purchase Details
Closed on
Mar 26, 2003
Sold by
Citifinancial Mortgage Co Inc Sbm Associ
Bought by
Leveson Harris
Purchase Details
Closed on
Jan 7, 2003
Sold by
Finley Charles E
Bought by
Citifinancial Mortgage Co Inc Sbm Associ
Purchase Details
Closed on
May 8, 1995
Sold by
Bluebonnet Investors
Bought by
Finley Charles E
Purchase Details
Closed on
Apr 10, 1995
Sold by
Marsh Carolyn Watkins By Atty/Fact
Bought by
Bluebonnet Investors
Purchase Details
Closed on
May 1, 1990
Sold by
Cederberg Ohm and Cederberg S
Bought by
Marsh Carolyn W
Purchase Details
Closed on
Mar 1, 1979
Sold by
Bluebonnet Investors
Bought by
Cederberg O
Create a Home Valuation Report for This Property
The Home Valuation Report is an in-depth analysis detailing your home's value as well as a comparison with similar homes in the area
Home Values in the Area
Average Home Value in this Area
Purchase History
| Date | Buyer | Sale Price | Title Company |
|---|---|---|---|
| Palmer Donnie | $482,500 | -- | |
| Jenha Properties Llc | -- | -- | |
| Leveson Harris | $30,000 | -- | |
| Citifinancial Mortgage Co Inc Sbm Associ | $32,100 | -- | |
| Finley Charles E | $58,900 | -- | |
| Bluebonnet Investors | $86,900 | -- | |
| Marsh Carolyn W | -- | -- | |
| Cederberg O | -- | -- |
Source: Public Records
Tax History Compared to Growth
Tax History
| Year | Tax Paid | Tax Assessment Tax Assessment Total Assessment is a certain percentage of the fair market value that is determined by local assessors to be the total taxable value of land and additions on the property. | Land | Improvement |
|---|---|---|---|---|
| 2024 | $458 | $9,600 | $252 | $9,348 |
| 2023 | $447 | $9,600 | $252 | $9,348 |
| 2022 | $449 | $9,600 | $252 | $9,348 |
| 2021 | $335 | $9,600 | $252 | $9,348 |
| 2020 | $417 | $9,600 | $252 | $9,348 |
| 2019 | $419 | $9,600 | $252 | $9,348 |
| 2018 | $421 | $9,600 | $252 | $9,348 |
| 2017 | $392 | $9,600 | $252 | $9,348 |
| 2016 | $361 | $9,600 | $252 | $9,348 |
| 2015 | $426 | $10,412 | $252 | $10,160 |
| 2014 | $469 | $11,600 | $1,440 | $10,160 |
Source: Public Records
Map
Nearby Homes
- 1901 S Flintlock Dr
- 2034 N Riverview Cir
- 1982 S Riverview Cir
- 1980 S Riverview Cir
- 1978 S Riverview Cir
- 1604, 1606, 1607 Cromartie Beach Dr
- 1616 Cromartie Beach Dr
- 1618 Beverly Ave
- 1524 Grand Cypress Ln
- 1522 Grand Cypress Ln
- 1500 Evelyn Ave
- 1412 Westcliff Ct
- 1405 Westcliff Ct
- 1308 Congressional Ct
- 1302 Congressional Ct
- 622 Gable Rd
- 1200 River Pointe Dr
- 1312 River Pointe Dr
- 1408 River Pointe Dr
- 1812 River Pointe Dr
- 2011 N Skylane Dr
- 2007 N Skylane Dr
- 2010 N Flintlock Dr
- 2012 N Flintlock Dr
- 2013 N Skylane Dr
- 2008 N Flintlock Dr
- 2005 N Skylane Dr
- 2006 N Flintlock Dr
- 2014 N Flintlock Dr
- 2006 N Skylane Dr
- 2008 N Skylane Dr
- 2015 N Skylane Dr
- 2004 N Flintlock Dr
- 2004 N Skylane Dr
- 2010 N Skylane Dr
- 2003 N Skylane Dr
- 2016 N Flintlock Dr
- 2002 N Flintlock Dr
- 2005 Mid Place Ave
- 2009 N Flintlock Dr