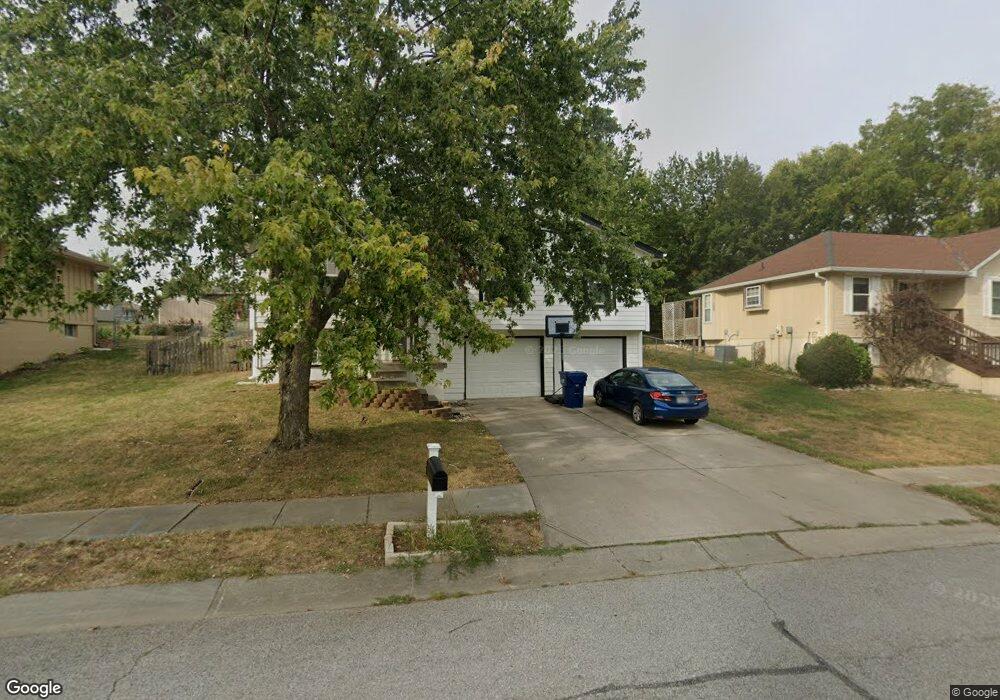
2009 NE Wien Ave Blue Springs, MO 64029
Estimated Value: $272,000 - $310,100
3
Beds
3
Baths
1,204
Sq Ft
$241/Sq Ft
Est. Value
About This Home
This home is located at 2009 NE Wien Ave, Blue Springs, MO 64029 and is currently estimated at $290,525, approximately $241 per square foot. 2009 NE Wien Ave is a home located in Jackson County with nearby schools including Grain Valley High School and St John Lalande School.
Ownership History
Date
Name
Owned For
Owner Type
Purchase Details
Closed on
Jun 15, 2004
Sold by
Owens Mark W and Owens Anita L
Bought by
Albertson David M and Albertson Caryn
Current Estimated Value
Home Financials for this Owner
Home Financials are based on the most recent Mortgage that was taken out on this home.
Original Mortgage
$123,028
Outstanding Balance
$61,427
Interest Rate
6.32%
Mortgage Type
FHA
Estimated Equity
$229,098
Purchase Details
Closed on
Jun 11, 2001
Sold by
Griggs Charles Richard and Griggs Elizabeth J
Bought by
Owens Mark W and Owens Anita L
Home Financials for this Owner
Home Financials are based on the most recent Mortgage that was taken out on this home.
Original Mortgage
$119,031
Interest Rate
7.11%
Mortgage Type
Purchase Money Mortgage
Purchase Details
Closed on
Sep 5, 1995
Sold by
Giro Custom Homes Inc
Bought by
Griggs Charles Richard and Griggs Elizabeth J
Home Financials for this Owner
Home Financials are based on the most recent Mortgage that was taken out on this home.
Original Mortgage
$86,598
Interest Rate
7.76%
Mortgage Type
Assumption
Create a Home Valuation Report for This Property
The Home Valuation Report is an in-depth analysis detailing your home's value as well as a comparison with similar homes in the area
Home Values in the Area
Average Home Value in this Area
Purchase History
| Date | Buyer | Sale Price | Title Company |
|---|---|---|---|
| Albertson David M | -- | Security Land Title Company | |
| Owens Mark W | -- | Coffelt Land Title | |
| Griggs Charles Richard | -- | -- |
Source: Public Records
Mortgage History
| Date | Status | Borrower | Loan Amount |
|---|---|---|---|
| Open | Albertson David M | $123,028 | |
| Previous Owner | Owens Mark W | $119,031 | |
| Previous Owner | Griggs Charles Richard | $86,598 |
Source: Public Records
Tax History Compared to Growth
Tax History
| Year | Tax Paid | Tax Assessment Tax Assessment Total Assessment is a certain percentage of the fair market value that is determined by local assessors to be the total taxable value of land and additions on the property. | Land | Improvement |
|---|---|---|---|---|
| 2025 | $2,654 | $38,696 | $6,067 | $32,629 |
| 2024 | $2,654 | $34,343 | $4,885 | $29,458 |
| 2023 | $2,550 | $34,342 | $3,699 | $30,643 |
| 2022 | $2,415 | $29,260 | $4,408 | $24,852 |
| 2021 | $2,353 | $29,260 | $4,408 | $24,852 |
| 2020 | $2,354 | $29,213 | $4,408 | $24,805 |
| 2019 | $2,290 | $29,213 | $4,408 | $24,805 |
| 2018 | $2,135 | $25,424 | $3,836 | $21,588 |
| 2017 | $2,015 | $25,424 | $3,836 | $21,588 |
| 2016 | $2,015 | $23,978 | $3,876 | $20,102 |
| 2014 | $1,885 | $22,205 | $3,868 | $18,337 |
Source: Public Records
Map
Nearby Homes
- 2104 NE Wyndham Place
- 1855 NE Duncan Rd
- 2237 NE Maybrook Dr
- 2372 NE Colonnade Ave
- 2210 NE Treetop Dr
- 2340 NE Colonnade Ave
- 2344 NE Colonnade Ave
- 2341 NE Colonnade Ave
- 2345 NE Colonnade Ave
- 2309 NE 23rd St
- 2352 NE Colonnade Ave
- 2304 NE 23rd St
- 2353 NE Colonnade Ave
- 2400 NE Porter Rd
- 2360 NE Colonnade Ave
- 2369 NE Colonnade Ave
- 2373 NE Colonnade Ave
- 2367 NE Skopelos Ct
- 2376 NE Skopelos Ct
- 2332 NE Andromada Ct
- 2015 NE Wien Ave Unit BEDROOM 1B - 651482
- 2015 NE Wien Ave Unit BEDROOM 2D - 651488
- 2013 NE Wien Ave
- 2805 NE Wien Avenue Bedroom 2d
- 2005 NE Wien Ave
- 2005 NE Wien Ave Unit BEDROOM 2B - 651485
- 2008 NE Village Ct
- 2004 NE Village Ct
- 2012 NE Wien Ave
- 2008 NE Wien Ave
- 1600 NE 20th St
- 2012 NE Village Ct
- 1608 NE 20th St
- 1512 NE 20th St
- 2085 NE Wien Avenue Bedroom 1a
- 1506 NE 20th St
- 1601 NE 20th St
- 1605 NE 20th St
- 1500 NE 20th St
- 1920 NE Wien Ave