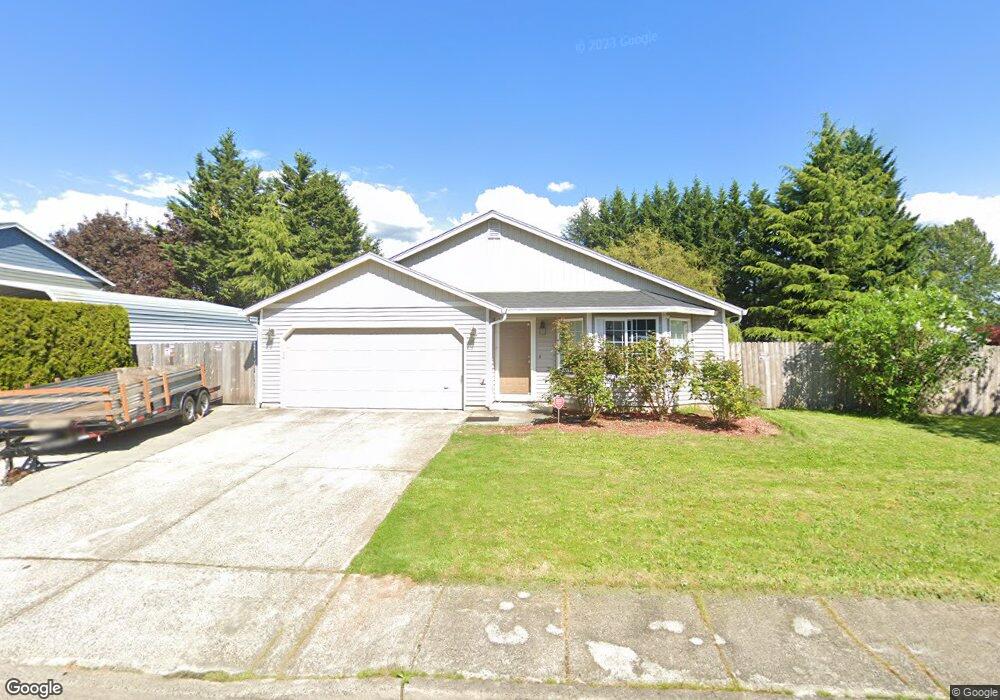
2009 NW 9th Ave Battle Ground, WA 98604
Estimated Value: $459,000 - $490,000
3
Beds
2
Baths
1,300
Sq Ft
$368/Sq Ft
Est. Value
About This Home
This home is located at 2009 NW 9th Ave, Battle Ground, WA 98604 and is currently estimated at $477,814, approximately $367 per square foot. 2009 NW 9th Ave is a home located in Clark County with nearby schools including Captain Strong Primary School, Chief Umtuch Middle School, and Battle Ground High School.
Ownership History
Date
Name
Owned For
Owner Type
Purchase Details
Closed on
Apr 5, 2021
Sold by
Ryan John T
Bought by
Ryan Jessica F
Current Estimated Value
Home Financials for this Owner
Home Financials are based on the most recent Mortgage that was taken out on this home.
Original Mortgage
$280,000
Outstanding Balance
$252,398
Interest Rate
2.9%
Mortgage Type
New Conventional
Estimated Equity
$225,416
Purchase Details
Closed on
Apr 1, 2021
Sold by
Mallory Michelle K
Bought by
Ryan Jessica F
Home Financials for this Owner
Home Financials are based on the most recent Mortgage that was taken out on this home.
Original Mortgage
$280,000
Outstanding Balance
$252,398
Interest Rate
2.9%
Mortgage Type
New Conventional
Estimated Equity
$225,416
Purchase Details
Closed on
Oct 4, 2016
Sold by
Mallory Scott B
Bought by
Mallory Michelle K
Home Financials for this Owner
Home Financials are based on the most recent Mortgage that was taken out on this home.
Original Mortgage
$211,900
Interest Rate
3.43%
Mortgage Type
New Conventional
Purchase Details
Closed on
Jun 1, 2006
Sold by
Lundeen Joel E and Lundeen Dawn Eve
Bought by
Mallory Scott B and Mallory Michelle K
Home Financials for this Owner
Home Financials are based on the most recent Mortgage that was taken out on this home.
Original Mortgage
$45,980
Interest Rate
6.55%
Mortgage Type
Stand Alone Second
Purchase Details
Closed on
Apr 15, 2005
Sold by
Nickolas Nick
Bought by
Lundeen Joel and Lundeen Dawn Eve
Home Financials for this Owner
Home Financials are based on the most recent Mortgage that was taken out on this home.
Original Mortgage
$177,219
Interest Rate
5.84%
Mortgage Type
FHA
Purchase Details
Closed on
Jul 13, 2001
Sold by
Nickolas Marcee D
Bought by
Nickolas Nick
Home Financials for this Owner
Home Financials are based on the most recent Mortgage that was taken out on this home.
Original Mortgage
$137,000
Interest Rate
7.37%
Purchase Details
Closed on
Jan 28, 1998
Sold by
Seppala Homes Inc
Bought by
Nickolas Nick and Nickolas Marcee D
Home Financials for this Owner
Home Financials are based on the most recent Mortgage that was taken out on this home.
Original Mortgage
$108,027
Interest Rate
7.05%
Mortgage Type
FHA
Purchase Details
Closed on
Jan 6, 1998
Sold by
Brosseau Fred and Brosseau Twila Dawn
Bought by
Seppala Homes Inc
Home Financials for this Owner
Home Financials are based on the most recent Mortgage that was taken out on this home.
Original Mortgage
$108,027
Interest Rate
7.05%
Mortgage Type
FHA
Create a Home Valuation Report for This Property
The Home Valuation Report is an in-depth analysis detailing your home's value as well as a comparison with similar homes in the area
Home Values in the Area
Average Home Value in this Area
Purchase History
| Date | Buyer | Sale Price | Title Company |
|---|---|---|---|
| Ryan Jessica F | -- | Wfg Clark County Resware | |
| Ryan Jessica F | $350,000 | Wfg Clark County Resware | |
| Mallory Michelle K | -- | Stewart Title Vancouver | |
| Mallory Scott B | $229,900 | Fidelity National Title | |
| Lundeen Joel | $180,000 | Fidelity National Title | |
| Nickolas Nick | -- | Chicago Title Insurance Co | |
| Nickolas Nick | $108,700 | Clark County Title | |
| Seppala Homes Inc | -- | Clark County Title |
Source: Public Records
Mortgage History
| Date | Status | Borrower | Loan Amount |
|---|---|---|---|
| Open | Ryan Jessica F | $280,000 | |
| Previous Owner | Mallory Michelle K | $211,900 | |
| Previous Owner | Mallory Scott B | $45,980 | |
| Previous Owner | Mallory Scott B | $183,920 | |
| Previous Owner | Lundeen Joel | $177,219 | |
| Previous Owner | Nickolas Nick | $137,000 | |
| Previous Owner | Nickolas Nick | $108,027 |
Source: Public Records
Tax History Compared to Growth
Tax History
| Year | Tax Paid | Tax Assessment Tax Assessment Total Assessment is a certain percentage of the fair market value that is determined by local assessors to be the total taxable value of land and additions on the property. | Land | Improvement |
|---|---|---|---|---|
| 2025 | $3,309 | $406,945 | $155,000 | $251,945 |
| 2024 | $2,962 | $405,633 | $155,000 | $250,633 |
| 2023 | $3,044 | $413,022 | $155,000 | $258,022 |
| 2022 | $3,032 | $387,084 | $123,250 | $263,834 |
| 2021 | $2,979 | $335,063 | $106,250 | $228,813 |
| 2020 | $2,539 | $301,956 | $97,750 | $204,206 |
| 2019 | $2,111 | $291,647 | $100,300 | $191,347 |
| 2018 | $2,577 | $283,631 | $0 | $0 |
| 2017 | $2,168 | $254,526 | $0 | $0 |
| 2016 | $2,145 | $233,142 | $0 | $0 |
| 2015 | $2,094 | $211,673 | $0 | $0 |
| 2014 | -- | $196,041 | $0 | $0 |
| 2013 | -- | $177,170 | $0 | $0 |
Source: Public Records
Map
Nearby Homes
- 617 NW 21st St
- 1904 NW 21st Cir
- 1908 NW 21st Cir
- 706 NW 23rd St
- 2661 NW 9th Place
- 2804 NW 8th Ave
- 2812 NW 8th Ave
- 2820 NW 8th Ave
- 2801 NW 8th Ave
- 2828 NW 8th Ave
- 742 NW 28th St
- 2809 NW 8th Ave
- 734 NW 28th St
- 771 NW 29th St
- 650 NW 28th St
- 2115 NW 17th Place
- 110 NW 24th St
- 2119 NW 17th Place
- 642 NW 28th St
- 755 NW 29th St
- 2010 NW 8th Ave
- 2105 NW 9th Ave
- 2010 NW 9th Ave
- 2106 NW 8th Ave
- 809 NW 20th St
- 2008 NW 9th Ave
- 817 NW 20th St
- 2104 NW 9th Ave
- 2009 NW 8th Ave
- 2113 NW 9th Ave
- 2112 NW 8th Ave
- 802 NW 20th Cir
- 800 NW 20th Cir
- 2112 NW 9th Ave
- 720 NW 21st St
- 719 NW 21st St
- 2003 NW 8th Ave
- 804 NW 20th Cir
- 2116 NW 8th Ave
- 2117 NW 9th Ave