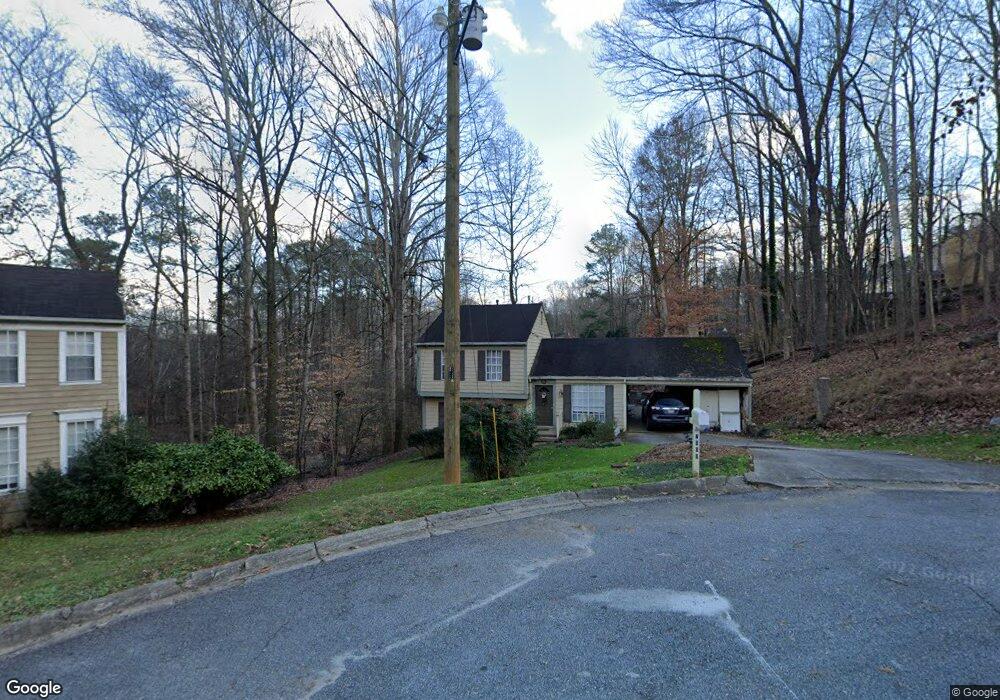
2009 Old Mill Way Duluth, GA 30096
Estimated Value: $241,000 - $319,425
4
Beds
2
Baths
1,338
Sq Ft
$214/Sq Ft
Est. Value
About This Home
This home is located at 2009 Old Mill Way, Duluth, GA 30096 and is currently estimated at $286,356, approximately $214 per square foot. 2009 Old Mill Way is a home located in Gwinnett County with nearby schools including Beaver Ridge Elementary School, Summerour Middle School, and Norcross High School.
Ownership History
Date
Name
Owned For
Owner Type
Purchase Details
Closed on
Nov 15, 2018
Sold by
Olivera Susana
Bought by
Silvani Armida R
Current Estimated Value
Home Financials for this Owner
Home Financials are based on the most recent Mortgage that was taken out on this home.
Original Mortgage
$104,029
Outstanding Balance
$89,755
Interest Rate
4.5%
Mortgage Type
FHA
Estimated Equity
$196,601
Purchase Details
Closed on
Nov 2, 2006
Sold by
Cruz Delia
Bought by
Vega Susana M and Vega Monica
Home Financials for this Owner
Home Financials are based on the most recent Mortgage that was taken out on this home.
Original Mortgage
$132,353
Interest Rate
6.36%
Mortgage Type
FHA
Purchase Details
Closed on
May 29, 2003
Sold by
Hill Cynthia J
Bought by
Cruz Delia
Home Financials for this Owner
Home Financials are based on the most recent Mortgage that was taken out on this home.
Original Mortgage
$18,500
Interest Rate
5.56%
Mortgage Type
Unknown
Purchase Details
Closed on
Aug 6, 1997
Sold by
Harrod Janet A
Bought by
Hill Cynthia J
Home Financials for this Owner
Home Financials are based on the most recent Mortgage that was taken out on this home.
Original Mortgage
$76,500
Interest Rate
7.59%
Mortgage Type
New Conventional
Create a Home Valuation Report for This Property
The Home Valuation Report is an in-depth analysis detailing your home's value as well as a comparison with similar homes in the area
Home Values in the Area
Average Home Value in this Area
Purchase History
| Date | Buyer | Sale Price | Title Company |
|---|---|---|---|
| Silvani Armida R | $113,600 | -- | |
| Vega Susana M | $133,400 | -- | |
| Cruz Delia | $123,500 | -- | |
| Hill Cynthia J | $85,000 | -- |
Source: Public Records
Mortgage History
| Date | Status | Borrower | Loan Amount |
|---|---|---|---|
| Open | Silvani Armida R | $104,029 | |
| Previous Owner | Vega Susana M | $132,353 | |
| Previous Owner | Cruz Delia | $18,500 | |
| Previous Owner | Cruz Delia | $98,800 | |
| Previous Owner | Hill Cynthia J | $76,500 |
Source: Public Records
Tax History Compared to Growth
Tax History
| Year | Tax Paid | Tax Assessment Tax Assessment Total Assessment is a certain percentage of the fair market value that is determined by local assessors to be the total taxable value of land and additions on the property. | Land | Improvement |
|---|---|---|---|---|
| 2025 | $2,999 | $108,280 | $26,800 | $81,480 |
| 2024 | $3,115 | $108,280 | $26,800 | $81,480 |
| 2023 | $3,115 | $108,280 | $26,800 | $81,480 |
| 2022 | $2,854 | $98,040 | $22,000 | $76,040 |
| 2021 | $2,311 | $70,520 | $16,080 | $54,440 |
| 2020 | $2,326 | $70,520 | $16,080 | $54,440 |
| 2019 | $1,646 | $45,440 | $9,200 | $36,240 |
| 2018 | $1,951 | $48,320 | $10,800 | $37,520 |
| 2016 | $1,454 | $33,600 | $7,200 | $26,400 |
| 2015 | $1,468 | $33,600 | $7,200 | $26,400 |
| 2014 | $1,475 | $33,600 | $7,200 | $26,400 |
Source: Public Records
Map
Nearby Homes
- 4781 Valley Ridge Dr
- 2082 Montgomery Trail
- 4787 Greenway Rd
- 2055 Lake Ford Cir
- 4880 Racquet Ct
- 2318 Ingram Rd
- 5045 Racquet Ct
- 5041 Rockborough Trail Unit 3
- 5055 Running Fox Trail
- 5065 Rockborough Trail NW
- 4935 Rockborough Trail
- 2385 Muirfield Way
- 4767 Glenwhite Dr
- 5106 Rockborough Trail
- 4786 Masters Ct Unit 4
- 2037 Pinnacle Pointe Dr
- 101 Vineyard Pond Dr NW
- 4981 Sharp Way
- 2066 Pinnacle Pointe Dr
- 2019 Old Mill Way
- 1974 Valley Ridge Ln
- 1964 Valley Ridge Ln
- 1964 Valley Ridge Ln Unit 3, Lot 18
- 1984 Valley Ridge Ln
- 2029 Old Mill Way
- 2028 Old Mill Way
- 1966 Valley Ridge Ln
- 1958 Old Hickory Ct Unit 3
- 1954 Valley Ridge Ln
- 1994 Valley Ridge Ln
- 2039 Old Mill Way Unit 2
- 0 Old Mill Way
- 2038 Old Mill Way Unit 2
- 4681 Valley Ridge Dr
- 4681 Valley Ridge Dr
- 1953 Valley Ridge Ln
- 4661 Valley Ridge Dr
- 0 Valley Ridge Ln Unit 7205379
- 0 Valley Ridge Ln Unit 7028958