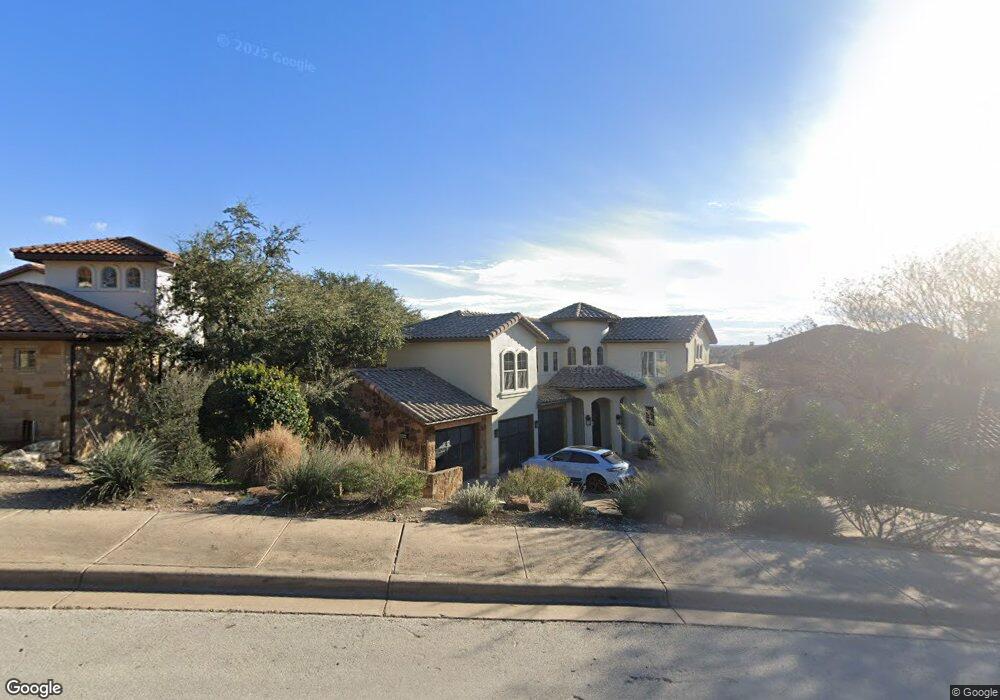
2009 Sea Eagle View Austin, TX 78738
Estimated Value: $1,577,572 - $1,830,000
5
Beds
5
Baths
3,954
Sq Ft
$430/Sq Ft
Est. Value
About This Home
This home is located at 2009 Sea Eagle View, Austin, TX 78738 and is currently estimated at $1,700,893, approximately $430 per square foot. 2009 Sea Eagle View is a home located in Travis County with nearby schools including Lake Pointe Elementary School, Bee Cave Middle School, and Lake Travis High School.
Ownership History
Date
Name
Owned For
Owner Type
Purchase Details
Closed on
Sep 25, 2006
Sold by
National Residential Nominee Svcs Inc
Bought by
Engholm John
Current Estimated Value
Home Financials for this Owner
Home Financials are based on the most recent Mortgage that was taken out on this home.
Original Mortgage
$600,000
Interest Rate
5.75%
Mortgage Type
Purchase Money Mortgage
Purchase Details
Closed on
Aug 23, 2006
Sold by
Macdonell Scott and Macdonell Kelcee
Bought by
National Residential Nominee Services In
Home Financials for this Owner
Home Financials are based on the most recent Mortgage that was taken out on this home.
Original Mortgage
$600,000
Interest Rate
5.75%
Mortgage Type
Purchase Money Mortgage
Purchase Details
Closed on
Feb 13, 2006
Sold by
Streeter Paul and Streeter Tanya
Bought by
Macdonell Scot
Home Financials for this Owner
Home Financials are based on the most recent Mortgage that was taken out on this home.
Original Mortgage
$704,000
Interest Rate
5.62%
Mortgage Type
Fannie Mae Freddie Mac
Purchase Details
Closed on
Apr 25, 2005
Sold by
Capital Pacific Holdings Llc
Bought by
Streeter Paul and Streeter Tanya
Create a Home Valuation Report for This Property
The Home Valuation Report is an in-depth analysis detailing your home's value as well as a comparison with similar homes in the area
Home Values in the Area
Average Home Value in this Area
Purchase History
| Date | Buyer | Sale Price | Title Company |
|---|---|---|---|
| Engholm John | -- | Alamo Title Company | |
| National Residential Nominee Services In | -- | Alamo Title Company | |
| Macdonell Scot | -- | Alamo Title Company | |
| Streeter Paul | -- | Fidelity National Title Comp |
Source: Public Records
Mortgage History
| Date | Status | Borrower | Loan Amount |
|---|---|---|---|
| Previous Owner | Engholm John | $600,000 | |
| Previous Owner | Macdonell Scot | $704,000 |
Source: Public Records
Tax History
| Year | Tax Paid | Tax Assessment Tax Assessment Total Assessment is a certain percentage of the fair market value that is determined by local assessors to be the total taxable value of land and additions on the property. | Land | Improvement |
|---|---|---|---|---|
| 2025 | $19,970 | $1,475,670 | -- | -- |
| 2023 | $16,083 | $1,219,562 | $0 | $0 |
| 2022 | $21,192 | $1,108,693 | $0 | $0 |
| 2021 | $20,269 | $1,007,903 | $127,500 | $1,142,619 |
| 2020 | $19,593 | $916,275 | $127,500 | $788,775 |
| 2018 | $20,477 | $914,000 | $127,500 | $786,500 |
| 2017 | $20,603 | $910,904 | $127,500 | $783,404 |
| 2016 | $19,025 | $841,112 | $159,375 | $681,737 |
| 2015 | $15,537 | $837,779 | $159,375 | $678,404 |
| 2014 | $15,537 | $806,693 | $159,375 | $647,318 |
Source: Public Records
Map
Nearby Homes
- 11901 Preserve Vista Terrace
- 1901 Sea Eagle View
- 12004 Preserve Vista Terrace
- 12027 Pleasant Panorama View
- 11805 Pleasant Panorama View
- 12006 Pleasant Panorama View
- 2104 Cades Spirit Bend
- 11524 Emerald Falls Dr
- 2630 Cascade Falls Dr
- 2732 Cascade Falls Dr
- 11916 Loomis Dr
- 12052 Tulare Dr
- 3312 Marin Ct
- 11710 Uplands Ridge Dr
- 17604 Hattie Trace
- 12610 River Bend
- 3512 Savoy Ct
- 11803 Astoria Dr
- 1116 Terjo Ln
- 1302 S Quinlan Park Rd
- 2013 Sea Eagle View
- 2005 Sea Eagle View
- 2017 Sea Eagle View
- 2200 Windswept Dr
- 11905 Sea Eagle View Cove
- 11905 Sea Eagle Cove
- 2006 Sea Eagle View
- 11901 Sea Eagle View Cove
- 2010 Sea Eagle View
- 11901 Sea Eagle View Cove
- 2101 Sea Eagle View
- 2204 Windswept Dr
- 2201 Windswept Dr
- 2000 Sea Eagle View
- 2100 Sea Eagle View
- 11900 Sea Eagle View Cove
- 12013 Preserve Vista Terrace
- 2105 Sea Eagle View
- 2201 Rimrock Dr
- 2208 Windswept Dr
Your Personal Tour Guide
Ask me questions while you tour the home.