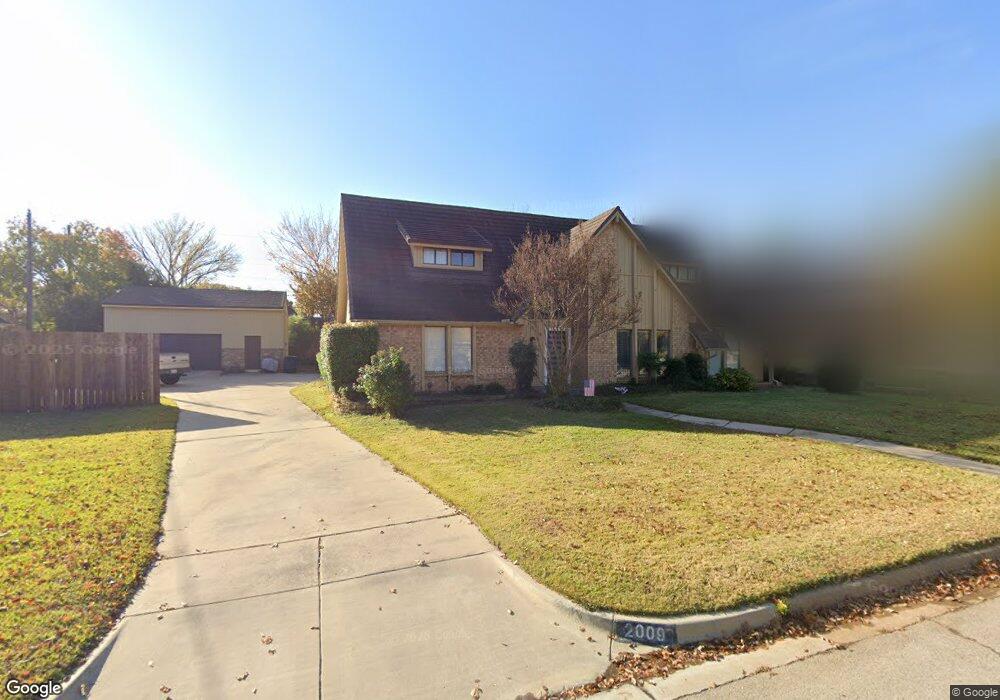
2009 Woodstock Dr Colleyville, TX 76034
Estimated Value: $669,778 - $742,000
4
Beds
4
Baths
2,975
Sq Ft
$238/Sq Ft
Est. Value
About This Home
This home is located at 2009 Woodstock Dr, Colleyville, TX 76034 and is currently estimated at $707,945, approximately $237 per square foot. 2009 Woodstock Dr is a home located in Tarrant County with nearby schools including Bransford Elementary School, Colleyville Middle School, and Covenant Christian Academy.
Ownership History
Date
Name
Owned For
Owner Type
Purchase Details
Closed on
Sep 30, 2015
Sold by
Abelson Nan Leah
Bought by
Lechner Cullen and Lechner Barbara
Current Estimated Value
Home Financials for this Owner
Home Financials are based on the most recent Mortgage that was taken out on this home.
Original Mortgage
$310,337
Outstanding Balance
$248,393
Interest Rate
4.4%
Mortgage Type
FHA
Estimated Equity
$459,552
Purchase Details
Closed on
May 12, 2011
Sold by
Dowd Judith A
Bought by
Abelson Nan Leah
Home Financials for this Owner
Home Financials are based on the most recent Mortgage that was taken out on this home.
Original Mortgage
$182,800
Interest Rate
4.87%
Mortgage Type
New Conventional
Purchase Details
Closed on
Dec 19, 2003
Sold by
Dowd Joseph J and Dowd Judith A
Bought by
Dowd Joseph J and Dowd Judith A
Create a Home Valuation Report for This Property
The Home Valuation Report is an in-depth analysis detailing your home's value as well as a comparison with similar homes in the area
Home Values in the Area
Average Home Value in this Area
Purchase History
| Date | Buyer | Sale Price | Title Company |
|---|---|---|---|
| Lechner Cullen | -- | Capital Title | |
| Abelson Nan Leah | -- | Reunion Title | |
| Dowd Joseph J | -- | -- |
Source: Public Records
Mortgage History
| Date | Status | Borrower | Loan Amount |
|---|---|---|---|
| Open | Lechner Cullen | $310,337 | |
| Previous Owner | Abelson Nan Leah | $182,800 |
Source: Public Records
Tax History Compared to Growth
Tax History
| Year | Tax Paid | Tax Assessment Tax Assessment Total Assessment is a certain percentage of the fair market value that is determined by local assessors to be the total taxable value of land and additions on the property. | Land | Improvement |
|---|---|---|---|---|
| 2025 | $2,338 | $574,169 | $156,300 | $417,869 |
| 2024 | $2,338 | $574,169 | $156,300 | $417,869 |
| 2023 | $9,650 | $577,427 | $156,300 | $421,127 |
| 2022 | $10,271 | $520,051 | $156,300 | $363,751 |
| 2021 | $10,387 | $496,148 | $93,780 | $402,368 |
| 2020 | $9,555 | $430,000 | $93,780 | $336,220 |
| 2019 | $9,942 | $430,000 | $100,000 | $330,000 |
| 2018 | $2,269 | $381,691 | $100,000 | $281,691 |
| 2017 | $9,129 | $386,422 | $120,000 | $266,422 |
| 2016 | $7,492 | $348,760 | $80,000 | $268,760 |
| 2015 | $6,483 | $288,300 | $35,000 | $253,300 |
| 2014 | $6,483 | $288,300 | $35,000 | $253,300 |
Source: Public Records
Map
Nearby Homes
- 3907 Windermere Dr
- 2204 Woodstock Dr
- 3827 Ashbury Ln
- 3813 Brookridge Ct
- 2001 Oak Knoll Dr
- 1820 Wimbleton Dr
- Seaberry II Plan at Grace Park - Signature Series
- Primrose FE V Plan at Grace Park - Signature Series
- Hawthorne Plan at Grace Park - Signature Series
- Seaberry Plan at Grace Park - Signature Series
- Gardenia Plan at Grace Park - Signature Series
- Bellflower IV Plan at Grace Park - Signature Series
- Bellflower II Plan at Grace Park - Signature Series
- Carolina IV Plan at Grace Park - Signature Series
- Carolina Plan at Grace Park - Signature Series
- Violet III Plan at Grace Park - Signature Series
- Violet IV Plan at Grace Park - Signature Series
- Magnolia III Plan at Grace Park - Signature Series
- Violet II Plan at Grace Park - Signature Series
- Rose II Plan at Grace Park - Signature Series
- 2101 Woodstock Dr
- 2007 Woodstock Dr
- 3908 Ambleside Dr
- 2008 Woodstock Dr
- 2103 Woodstock Dr
- 2005 Woodstock Dr
- 3921 Hillwood Way
- 3910 Ambleside Dr
- 3920 Welwyn Way Dr
- 3906 Woodstock Dr
- 2105 Woodstock Dr
- 3909 Woodstock Dr
- 3907 Ambleside Dr
- 3924 Hillwood Way
- 3912 Ambleside Dr
- 128 Cheek-Sparger Rd
- 3908 Woodstock Dr
- 3917 Hillwood Way
- 3916 Welwyn Way Dr
- 2107 Woodstock Dr