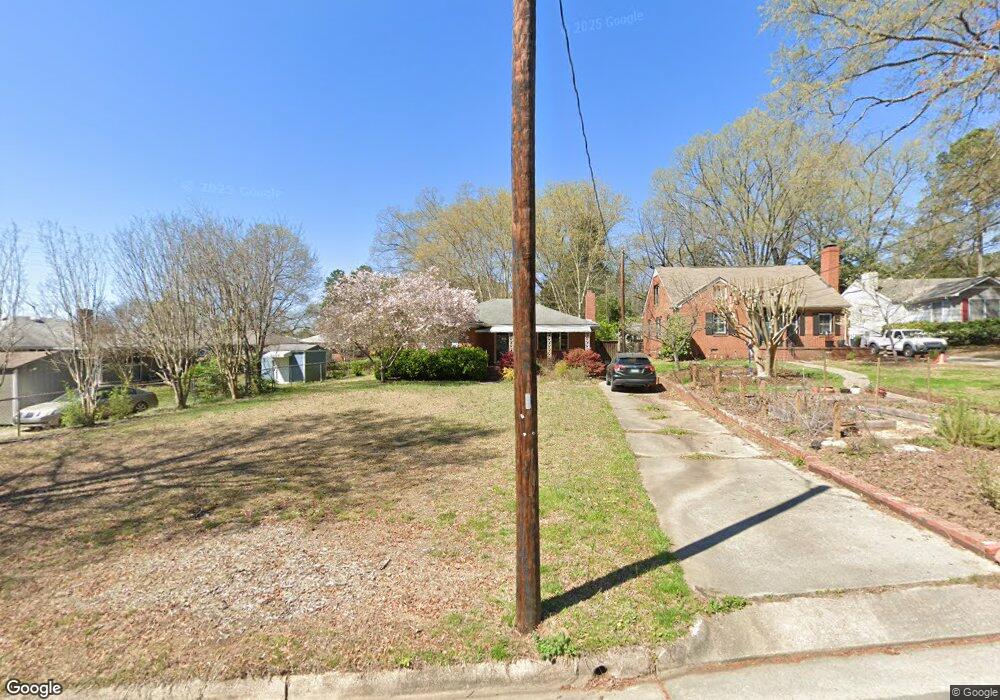
2009 Woodview Dr Durham, NC 27704
Northgate Park NeighborhoodEstimated Value: $293,179 - $346,000
3
Beds
1
Bath
1,127
Sq Ft
$286/Sq Ft
Est. Value
About This Home
This home is located at 2009 Woodview Dr, Durham, NC 27704 and is currently estimated at $322,545, approximately $286 per square foot. 2009 Woodview Dr is a home located in Durham County with nearby schools including W.G. Pearson Elementary School, Club Boulevard Elementary School, and Brogden Middle.
Ownership History
Date
Name
Owned For
Owner Type
Purchase Details
Closed on
Oct 20, 2009
Sold by
Bradley Linwood Cecil
Bought by
Brunnemer Mary M
Current Estimated Value
Home Financials for this Owner
Home Financials are based on the most recent Mortgage that was taken out on this home.
Original Mortgage
$148,265
Outstanding Balance
$96,567
Interest Rate
5.03%
Mortgage Type
FHA
Estimated Equity
$225,978
Purchase Details
Closed on
Jul 9, 2006
Sold by
Taylor Cousar Jennifer and Cousar Christopher L
Bought by
Bradley Linwood Cecil
Home Financials for this Owner
Home Financials are based on the most recent Mortgage that was taken out on this home.
Original Mortgage
$102,320
Interest Rate
6.54%
Mortgage Type
Purchase Money Mortgage
Purchase Details
Closed on
Jun 12, 1998
Sold by
Daniel Trevor L and Ralston Shawn L
Bought by
Taylor Jennifer Lynn
Home Financials for this Owner
Home Financials are based on the most recent Mortgage that was taken out on this home.
Original Mortgage
$90,500
Interest Rate
6.75%
Create a Home Valuation Report for This Property
The Home Valuation Report is an in-depth analysis detailing your home's value as well as a comparison with similar homes in the area
Home Values in the Area
Average Home Value in this Area
Purchase History
We collect this data history from publicly available records. To have your information removed, we recommend requesting removal directly through your county’s website.
| Date | Buyer | Sale Price | Title Company |
|---|---|---|---|
| Brunnemer Mary M | $151,000 | None Available | |
| Bradley Linwood Cecil | $128,000 | None Available | |
| Taylor Jennifer Lynn | $91,500 | -- |
Source: Public Records
Mortgage History
We collect this data history from publicly available records. To have your information removed, we recommend requesting removal directly through your county’s website.
| Date | Status | Borrower | Loan Amount |
|---|---|---|---|
| Open | Brunnemer Mary M | $148,265 | |
| Previous Owner | Bradley Linwood Cecil | $102,320 | |
| Previous Owner | Taylor Jennifer Lynn | $90,500 |
Source: Public Records
Tax History
| Year | Tax Paid | Tax Assessment Tax Assessment Total Assessment is a certain percentage of the fair market value that is determined by local assessors to be the total taxable value of land and additions on the property. | Land | Improvement |
|---|---|---|---|---|
| 2025 | $2,721 | $274,500 | $147,000 | $127,500 |
| 2024 | $2,507 | $179,744 | $45,112 | $134,632 |
| 2023 | $2,354 | $179,744 | $45,112 | $134,632 |
| 2022 | $2,301 | $179,744 | $45,112 | $134,632 |
| 2021 | $2,290 | $179,744 | $45,112 | $134,632 |
| 2020 | $2,236 | $179,744 | $45,112 | $134,632 |
| 2019 | $2,236 | $179,744 | $45,112 | $134,632 |
| 2018 | $1,777 | $130,971 | $27,067 | $103,904 |
| 2017 | $1,764 | $130,971 | $27,067 | $103,904 |
| 2016 | $1,704 | $130,971 | $27,067 | $103,904 |
| 2015 | $1,991 | $143,850 | $24,137 | $119,713 |
| 2014 | $1,991 | $143,850 | $24,137 | $119,713 |
Source: Public Records
Map
Nearby Homes
- 1902 Ruffin St
- 910 Ruby St
- 2121 Ruffin St
- 906 W Maynard Ave
- 924 Lorain Ave
- 2405 N Duke St
- 402 Chamberlin Ave Unit D
- 622 W Club Blvd
- 1309 Hudson Ave Unit E6
- 1309 Hudson Ave Unit D12
- 1309 Hudson Ave Unit A16
- 1309 Hudson Ave Unit D14
- 1309 Hudson Ave Unit D13
- 1309 Hudson Ave Unit 5
- 1309 Hudson Ave Unit E10
- 1309 Hudson Ave Unit D4
- 1309 Hudson Ave Unit E12
- 2505 N Duke St
- 2826 Herring Blvd
- 411 W Club Blvd
- 2011 Woodview Dr
- 806 Ruby St
- 802 Ruby St
- 2013 Woodview Dr
- 808 Ruby St
- 2015 Woodview Dr
- 2008 Woodview Dr
- 2010 Woodview Dr
- 2006 Woodview Dr
- 2002 N Duke St
- 2012 Woodview Dr
- 2000 N Duke St
- 2006 N Duke St
- 2002 Woodview Dr
- 2017 Woodview Dr
- 2014 Woodview Dr
- 2008 N Duke St
- 2018 Woodview Dr
- 2000 Woodview Dr
- 2010 N Duke St
Your Personal Tour Guide
Ask me questions while you tour the home.