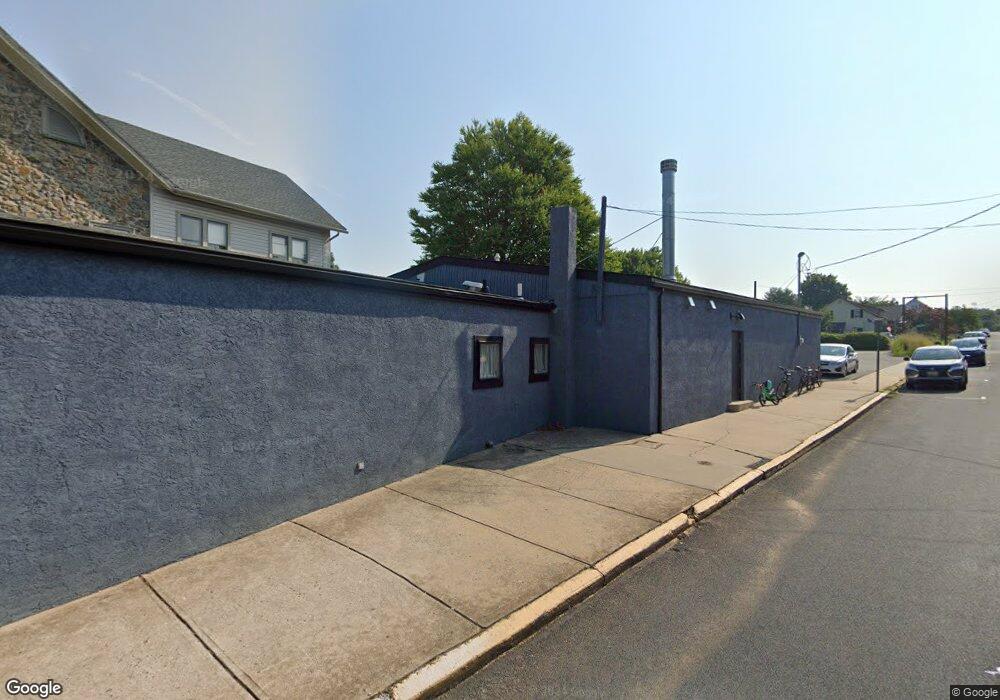
201 & 213 N Main St Coopersburg, PA 18036
Coopersburg Historic District NeighborhoodEstimated Value: $254,000
5
Beds
1
Bath
3,189
Sq Ft
$80/Sq Ft
Est. Value
About This Home
This home is located at 201 & 213 N Main St, Coopersburg, PA 18036 and is currently priced at $254,000, approximately $79 per square foot. 201 & 213 N Main St is a home located in Lehigh County with nearby schools including Southern Lehigh High School, Providence Hybrid Academy, and St. Michael the Archangel School.
Ownership History
Date
Name
Owned For
Owner Type
Purchase Details
Closed on
Apr 28, 2023
Sold by
Russ & H Llc
Bought by
Zandio Llc
Current Estimated Value
Home Financials for this Owner
Home Financials are based on the most recent Mortgage that was taken out on this home.
Original Mortgage
$962,000
Outstanding Balance
$936,258
Interest Rate
6.6%
Mortgage Type
VA
Purchase Details
Closed on
Nov 27, 2017
Sold by
Vcr Investments Llc
Bought by
Russ H Llc
Purchase Details
Closed on
Aug 31, 2006
Sold by
Price Carolyn D and Brown Margaret Price
Bought by
Vcr Investments Llc
Home Financials for this Owner
Home Financials are based on the most recent Mortgage that was taken out on this home.
Original Mortgage
$200,000
Interest Rate
6.71%
Mortgage Type
Purchase Money Mortgage
Purchase Details
Closed on
Sep 24, 1951
Bought by
Price Carolyn D
Create a Home Valuation Report for This Property
The Home Valuation Report is an in-depth analysis detailing your home's value as well as a comparison with similar homes in the area
Home Values in the Area
Average Home Value in this Area
Purchase History
| Date | Buyer | Sale Price | Title Company |
|---|---|---|---|
| Zandio Llc | -- | Hamilton Abstract | |
| Russ H Llc | $215,000 | Trident Land Transfer Compan | |
| Vcr Investments Llc | $225,000 | Penntitle Inc | |
| Price Carolyn D | -- | -- |
Source: Public Records
Mortgage History
| Date | Status | Borrower | Loan Amount |
|---|---|---|---|
| Open | Zandio Llc | $962,000 | |
| Previous Owner | Vcr Investments Llc | $200,000 |
Source: Public Records
Tax History Compared to Growth
Tax History
| Year | Tax Paid | Tax Assessment Tax Assessment Total Assessment is a certain percentage of the fair market value that is determined by local assessors to be the total taxable value of land and additions on the property. | Land | Improvement |
|---|---|---|---|---|
| 2025 | $6,800 | $257,200 | $64,400 | $192,800 |
| 2024 | $6,800 | $257,200 | $64,400 | $192,800 |
| 2023 | $6,800 | $257,200 | $65,100 | $192,100 |
| 2022 | $6,715 | $257,200 | $192,100 | $65,100 |
| 2021 | $6,560 | $256,100 | $65,100 | $191,000 |
| 2020 | $6,454 | $256,100 | $65,100 | $191,000 |
| 2019 | $5,641 | $226,900 | $40,600 | $186,300 |
| 2018 | $5,641 | $226,900 | $40,600 | $186,300 |
| 2017 | $5,595 | $226,900 | $40,600 | $186,300 |
| 2016 | -- | $226,900 | $40,600 | $186,300 |
| 2015 | -- | $226,900 | $40,600 | $186,300 |
| 2014 | -- | $226,900 | $40,600 | $186,300 |
Source: Public Records
Map
Nearby Homes
- 308 N Main St
- 135 S Main St
- 119 S Main St
- 818 W Station Ave
- 1008 W State St
- 6692 N Main St
- Helena Plan at Ashford Preserve
- Wells Plan at Ashford Preserve
- The Bennett Plan at Ashford Preserve
- Meadowood Plan at Ashford Preserve
- Anderson Plan at Ashford Preserve
- 119 Ashford Dr
- 180 Ashford Dr
- 161 Ashford Dr
- 6617 Gun Club Rd
- 7522 Clayton Ave
- 7555 Clayton Ave
- 7201 Suter Rd
- 6230 Main St
- 126 Ashford Dr
- 201 N Main St
- 209 N Main St
- 205 N Main St
- 530 E Landis St
- 528 E Landis St Unit 532
- 517 E Landis St
- 540 E Landis St
- 213 N Main St
- 520 E Landis St Unit 526
- 515 E Landis St Unit 521
- 109 N Main St Unit 113
- 219 N Main St
- 516 E Landis St Unit 518
- 514 E Landis St
- 516-518 E Landis St
- 124 N Main St
- 124 N Main St Unit GARAGE
- 124 N Main St Unit 2
- 124 N Main St Unit 1
- 511 E Landis St