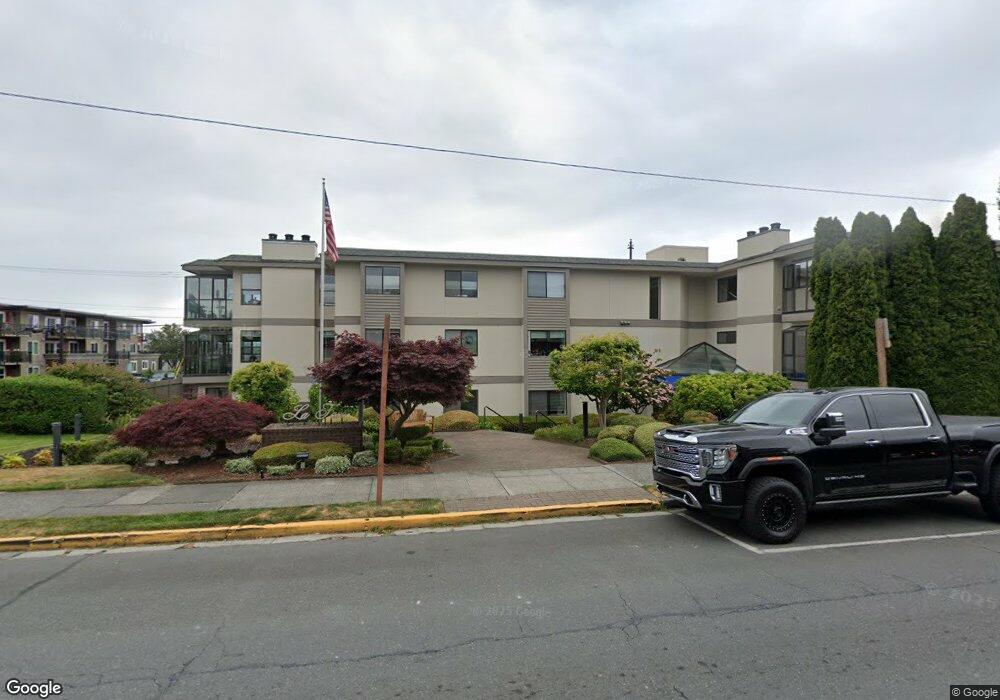
201 3rd Ave N Unit 316 Edmonds, WA 98020
Edmonds Bowl NeighborhoodEstimated Value: $804,000 - $1,049,000
2
Beds
2
Baths
1,568
Sq Ft
$568/Sq Ft
Est. Value
About This Home
This home is located at 201 3rd Ave N Unit 316, Edmonds, WA 98020 and is currently estimated at $891,005, approximately $568 per square foot. 201 3rd Ave N Unit 316 is a home located in Snohomish County with nearby schools including Edmonds Elementary School, College Place Middle School, and Edmonds-Woodway High School.
Ownership History
Date
Name
Owned For
Owner Type
Purchase Details
Closed on
Dec 19, 2014
Sold by
Jansen Linda J
Bought by
Babinski Gregory and Babinski Wurilege
Current Estimated Value
Home Financials for this Owner
Home Financials are based on the most recent Mortgage that was taken out on this home.
Original Mortgage
$417,000
Outstanding Balance
$320,359
Interest Rate
4%
Mortgage Type
New Conventional
Estimated Equity
$570,646
Purchase Details
Closed on
Jan 10, 2003
Sold by
Lewis Gerald L and Lewis Joanne
Bought by
Jansen Linda J
Home Financials for this Owner
Home Financials are based on the most recent Mortgage that was taken out on this home.
Original Mortgage
$292,125
Interest Rate
6.06%
Create a Home Valuation Report for This Property
The Home Valuation Report is an in-depth analysis detailing your home's value as well as a comparison with similar homes in the area
Home Values in the Area
Average Home Value in this Area
Purchase History
| Date | Buyer | Sale Price | Title Company |
|---|---|---|---|
| Babinski Gregory | $470,000 | First American Title | |
| Jansen Linda J | $307,500 | First American Title Ins Co |
Source: Public Records
Mortgage History
| Date | Status | Borrower | Loan Amount |
|---|---|---|---|
| Open | Babinski Gregory | $417,000 | |
| Previous Owner | Jansen Linda J | $292,125 |
Source: Public Records
Tax History
| Year | Tax Paid | Tax Assessment Tax Assessment Total Assessment is a certain percentage of the fair market value that is determined by local assessors to be the total taxable value of land and additions on the property. | Land | Improvement |
|---|---|---|---|---|
| 2025 | $4,770 | $644,400 | $302,500 | $341,900 |
| 2024 | $4,770 | $670,400 | $302,500 | $367,900 |
| 2023 | $4,089 | $595,600 | $302,500 | $293,100 |
| 2022 | $4,325 | $517,900 | $275,000 | $242,900 |
| 2020 | $4,538 | $486,000 | $275,000 | $211,000 |
| 2019 | $4,165 | $449,300 | $275,000 | $174,300 |
| 2018 | $4,596 | $428,340 | $275,000 | $153,340 |
| 2017 | $4,369 | $426,000 | $97,500 | $328,500 |
| 2016 | $3,975 | $384,000 | $78,000 | $306,000 |
Source: Public Records
Map
Nearby Homes
- 621 Daley St
- 640 Bell St
- 233 3rd Ave S Unit 305
- 609 7th Ave N Unit B304
- 623 Aloha Way
- 624 Alder St
- 546 Walnut St Unit 201
- 432 3rd Ave S Unit B204
- 712 Alder St
- 614 5th Ave S Unit C101
- 614 5th Ave S Unit C107
- 647 9th Ave N
- 816 Walnut St
- 217 9th Ave S
- 910 9th Ave N
- 960 5th Ave S Unit 208
- 926 Dayton St
- 902 7th Ave S
- 1020 5th Ave S Unit 2
- 817 Puget Way
- 201 3rd Ave N Unit 319
- 201 3rd Ave N Unit 318
- 201 3rd Ave N Unit 317
- 201 3rd Ave N Unit 315
- 201 3rd Ave N Unit 213
- 201 3rd Ave N Unit 212
- 201 3rd Ave N Unit 211
- 201 3rd Ave N Unit 210
- 201 3rd Ave N Unit 209
- 201 3rd Ave N Unit 208
- 201 3rd Ave N Unit 106
- 201 3rd Ave N Unit 105
- 201 3rd Ave N Unit 104
- 201 3rd Ave N Unit 103
- 201 3rd Ave N Unit 102
- 201 3rd Ave N Unit 101
- 200 2nd Ave N Unit 305
- 200 2nd Ave N Unit 304
- 200 2nd Ave N Unit 303
- 200 2nd Ave N Unit 302
Your Personal Tour Guide
Ask me questions while you tour the home.