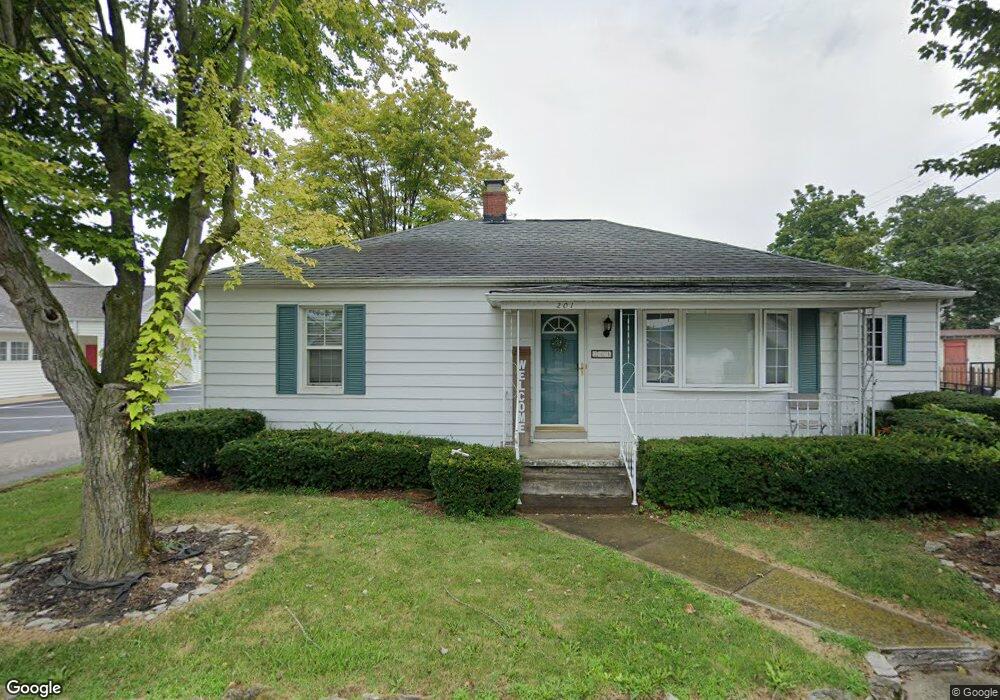
201 3rd St Sugar Grove, OH 43155
Estimated Value: $193,000 - $217,000
3
Beds
1
Bath
992
Sq Ft
$207/Sq Ft
Est. Value
About This Home
This home is located at 201 3rd St, Sugar Grove, OH 43155 and is currently estimated at $205,743, approximately $207 per square foot. 201 3rd St is a home located in Fairfield County with nearby schools including Berne Union Elementary School and Berne Union High School.
Ownership History
Date
Name
Owned For
Owner Type
Purchase Details
Closed on
Jun 2, 2021
Sold by
White Steven R and Thompson Katrina N
Bought by
Mandeville Chloe Mae and Kollister Derek Louis
Current Estimated Value
Home Financials for this Owner
Home Financials are based on the most recent Mortgage that was taken out on this home.
Original Mortgage
$151,320
Outstanding Balance
$137,001
Interest Rate
2.9%
Mortgage Type
New Conventional
Estimated Equity
$68,742
Purchase Details
Closed on
Aug 24, 2011
Sold by
Shull Richard R
Bought by
White Steven R and Thompson Katrina N
Home Financials for this Owner
Home Financials are based on the most recent Mortgage that was taken out on this home.
Original Mortgage
$91,597
Interest Rate
4.55%
Mortgage Type
New Conventional
Purchase Details
Closed on
Apr 22, 2008
Sold by
Shull Lila Jean and Shull Lila J
Bought by
Shull Richard R
Create a Home Valuation Report for This Property
The Home Valuation Report is an in-depth analysis detailing your home's value as well as a comparison with similar homes in the area
Home Values in the Area
Average Home Value in this Area
Purchase History
| Date | Buyer | Sale Price | Title Company |
|---|---|---|---|
| Mandeville Chloe Mae | $159,000 | None Available | |
| White Steven R | $88,500 | Attorney | |
| Shull Richard R | -- | Attorney |
Source: Public Records
Mortgage History
| Date | Status | Borrower | Loan Amount |
|---|---|---|---|
| Open | Mandeville Chloe Mae | $151,320 | |
| Previous Owner | White Steven R | $91,597 |
Source: Public Records
Tax History Compared to Growth
Tax History
| Year | Tax Paid | Tax Assessment Tax Assessment Total Assessment is a certain percentage of the fair market value that is determined by local assessors to be the total taxable value of land and additions on the property. | Land | Improvement |
|---|---|---|---|---|
| 2024 | $3,383 | $45,590 | $4,760 | $40,830 |
| 2023 | $1,651 | $45,590 | $4,760 | $40,830 |
| 2022 | $1,649 | $45,590 | $4,760 | $40,830 |
| 2021 | $1,503 | $37,770 | $4,140 | $33,630 |
| 2020 | $1,438 | $36,000 | $4,140 | $31,860 |
| 2019 | $1,441 | $36,000 | $4,140 | $31,860 |
| 2018 | $964 | $24,120 | $3,330 | $20,790 |
| 2017 | $905 | $24,120 | $3,330 | $20,790 |
| 2016 | $891 | $24,120 | $3,330 | $20,790 |
| 2015 | $874 | $23,250 | $3,330 | $19,920 |
| 2014 | $831 | $23,250 | $3,330 | $19,920 |
| 2013 | $831 | $23,250 | $3,330 | $19,920 |
Source: Public Records
Map
Nearby Homes
- 7280 Sugar Grove Rd SE
- 4155 Savage Hill Rd SE
- 820 Pump Station Rd SE
- 25779 Bailey Rd
- 1531 Tarkiln Rd SE
- 284 Blue Valley Rd SE
- 25345 Buena Vista Rd
- 1121 Tarkiln Rd SE Unit 109
- 26067 Buena Vista Rd
- 509 Tarkiln Rd SE
- 9847 Stage Rd
- 25127 Buena Vista Rd
- 27601 Leater Rd
- 8916 Roley Rd
- 9271 Roley Rd
- 513 Ross Rd SE
- 13370 Ohio 374
- 0 Roley Rd
- 1015 Taos Ln
- 4300 Bis Rd SW