201 5th Ave Tybee Island, GA 31328
Estimated Value: $734,000 - $803,985
4
Beds
2
Baths
1,918
Sq Ft
$402/Sq Ft
Est. Value
About This Home
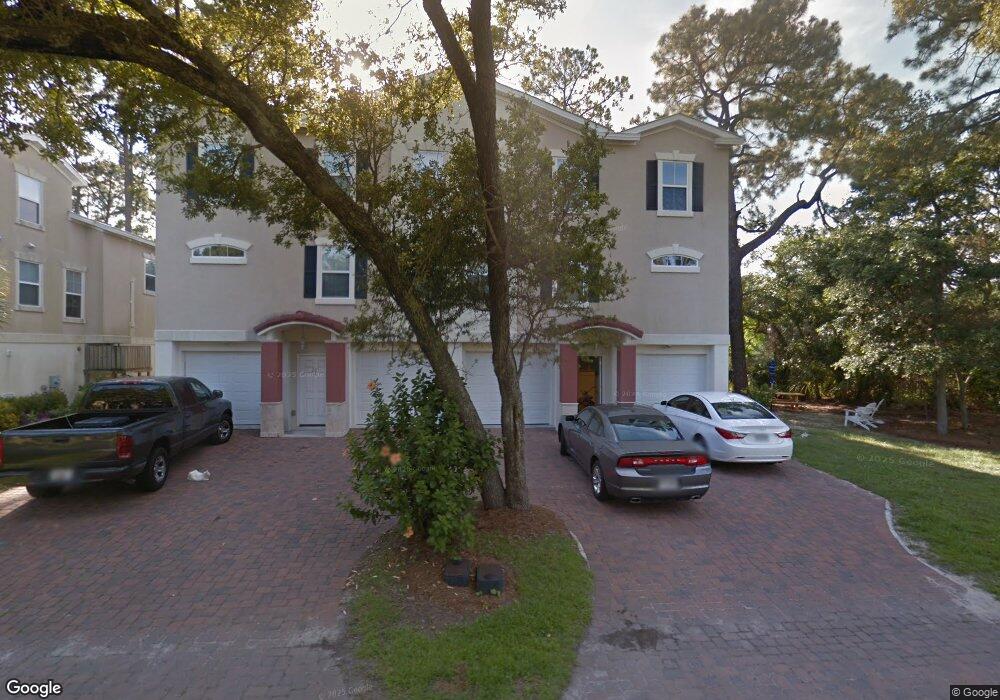
This home is located at 201 5th Ave, Tybee Island, GA 31328 and is currently estimated at $771,246, approximately $402 per square foot. 201 5th Ave is a home located in Chatham County with nearby schools including Howard Elementary School, Coastal Middle School, and Islands High School.
Ownership History
Date
Name
Owned For
Owner Type
Purchase Details
Closed on
Feb 6, 2018
Sold by
Shine John P
Bought by
Blr Savannah Llc
Current Estimated Value
Purchase Details
Closed on
Jun 2, 2017
Bought by
John Shine
Purchase Details
Closed on
Jul 2, 2007
Sold by
Not Provided
Bought by
Ramsay Cameron Llc
Home Financials for this Owner
Home Financials are based on the most recent Mortgage that was taken out on this home.
Original Mortgage
$107,000
Interest Rate
6.37%
Mortgage Type
New Conventional
Create a Home Valuation Report for This Property
The Home Valuation Report is an in-depth analysis detailing your home's value as well as a comparison with similar homes in the area
Home Values in the Area
Average Home Value in this Area
Purchase History
| Date | Buyer | Sale Price | Title Company |
|---|---|---|---|
| Blr Savannah Llc | $241,431 | -- | |
| John Shine | -- | -- | |
| Ramsay Cameron Llc | -- | -- |
Source: Public Records
Mortgage History
| Date | Status | Borrower | Loan Amount |
|---|---|---|---|
| Previous Owner | Ramsay Cameron Llc | $107,000 |
Source: Public Records
Tax History Compared to Growth
Tax History
| Year | Tax Paid | Tax Assessment Tax Assessment Total Assessment is a certain percentage of the fair market value that is determined by local assessors to be the total taxable value of land and additions on the property. | Land | Improvement |
|---|---|---|---|---|
| 2025 | $5,027 | $308,600 | $86,800 | $221,800 |
| 2024 | $5,027 | $277,480 | $86,800 | $190,680 |
| 2023 | $4,299 | $311,840 | $86,800 | $225,040 |
| 2022 | $4,708 | $281,080 | $86,800 | $194,280 |
| 2021 | $4,666 | $218,560 | $48,080 | $170,480 |
| 2020 | $4,880 | $218,560 | $48,080 | $170,480 |
| 2019 | $2,537 | $154,400 | $45,548 | $108,852 |
| 2018 | $4,321 | $161,120 | $47,880 | $113,240 |
| 2017 | $3,917 | $146,640 | $47,880 | $98,760 |
| 2016 | $3,916 | $121,560 | $47,880 | $73,680 |
| 2015 | $6,043 | $125,200 | $50,200 | $75,000 |
| 2014 | $5,978 | $125,400 | $0 | $0 |
Source: Public Records
Map
Nearby Homes
- 204 5th Ave
- 130 Lewis Ave
- 115 Jones Ave
- 113 Jones Ave
- 12 Village Place Unit B
- 208 Jones Ave
- 111 2nd Ave
- 409 Miller Ave
- 106 & 108 Lewis Ave
- 108 Lewis Ave
- 106 Lewis Ave
- 16 6th Ave
- 115 Lovell Ave
- 105 Lovell Ave
- 6 White Oak Ln
- 3 3rd St Unit 533
- 3 3rd St Unit 517
- 214 Butler Ave Unit 205
- 214 Butler Ave Unit 105
- 0 5th Ave Unit SA342444