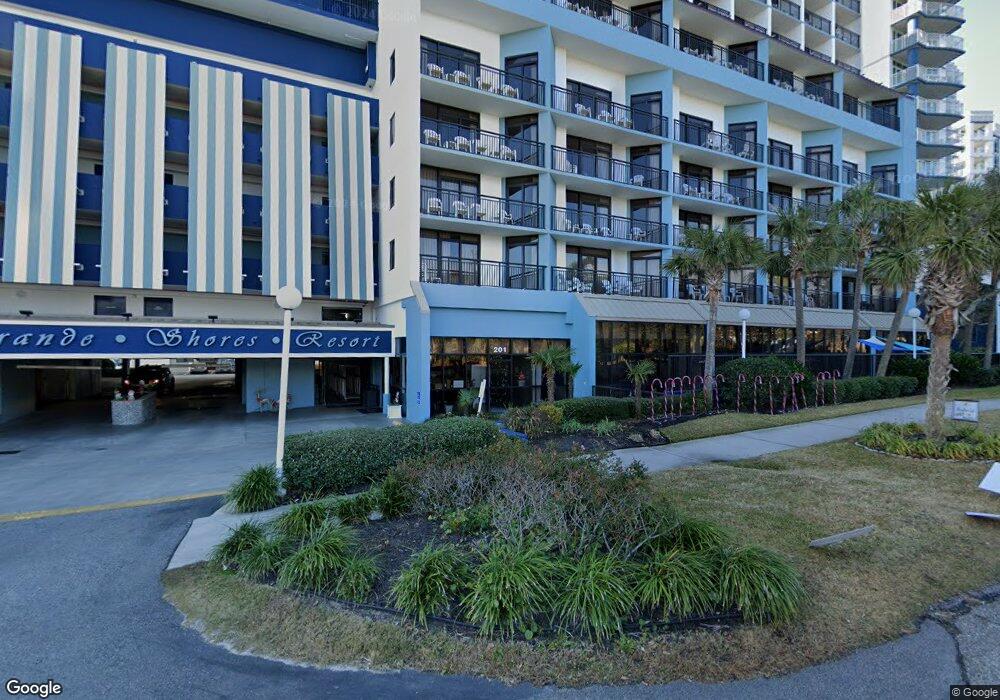
201 77th Ave N Unit PH 37 Grande Shores Myrtle Beach, SC 29572
Grande Dunes NeighborhoodEstimated Value: $138,000 - $166,000
1
Bed
1
Bath
551
Sq Ft
$275/Sq Ft
Est. Value
About This Home
This home is located at 201 77th Ave N Unit PH 37 Grande Shores, Myrtle Beach, SC 29572 and is currently estimated at $151,670, approximately $275 per square foot. 201 77th Ave N Unit PH 37 Grande Shores is a home located in Horry County with nearby schools including Myrtle Beach Child Development Center, Myrtle Beach Primary School, and Myrtle Beach Elementary School.
Ownership History
Date
Name
Owned For
Owner Type
Purchase Details
Closed on
Aug 28, 2012
Sold by
Regions Bank
Bought by
Wilmoth Eddie W
Current Estimated Value
Purchase Details
Closed on
Aug 16, 2012
Sold by
Master In Equity Horry County
Bought by
Regions Bank
Purchase Details
Closed on
Jul 6, 2005
Sold by
Dear David W
Bought by
Hu Zheng and Qiao Xlaogai
Home Financials for this Owner
Home Financials are based on the most recent Mortgage that was taken out on this home.
Original Mortgage
$248,000
Interest Rate
6.5%
Mortgage Type
Fannie Mae Freddie Mac
Purchase Details
Closed on
Feb 14, 2001
Sold by
Oceanfront Grande Bay Development Llc
Bought by
Dear David W
Home Financials for this Owner
Home Financials are based on the most recent Mortgage that was taken out on this home.
Original Mortgage
$112,400
Interest Rate
7.5%
Mortgage Type
Purchase Money Mortgage
Create a Home Valuation Report for This Property
The Home Valuation Report is an in-depth analysis detailing your home's value as well as a comparison with similar homes in the area
Home Values in the Area
Average Home Value in this Area
Purchase History
| Date | Buyer | Sale Price | Title Company |
|---|---|---|---|
| Wilmoth Eddie W | $74,900 | -- | |
| Regions Bank | $85,000 | -- | |
| Hu Zheng | $310,000 | -- | |
| Dear David W | $124,900 | -- |
Source: Public Records
Mortgage History
| Date | Status | Borrower | Loan Amount |
|---|---|---|---|
| Previous Owner | Hu Zheng | $248,000 | |
| Previous Owner | Dear David W | $112,400 |
Source: Public Records
Tax History Compared to Growth
Tax History
| Year | Tax Paid | Tax Assessment Tax Assessment Total Assessment is a certain percentage of the fair market value that is determined by local assessors to be the total taxable value of land and additions on the property. | Land | Improvement |
|---|---|---|---|---|
| 2024 | $1,617 | $10,200 | $0 | $10,200 |
| 2023 | $1,617 | $8,085 | $0 | $8,085 |
| 2021 | $1,492 | $8,085 | $0 | $8,085 |
| 2020 | $1,191 | $8,085 | $0 | $8,085 |
| 2019 | $1,191 | $8,085 | $0 | $8,085 |
| 2018 | $0 | $7,350 | $0 | $7,350 |
| 2017 | $1,105 | $4,200 | $0 | $4,200 |
| 2016 | -- | $4,200 | $0 | $4,200 |
| 2015 | $1,092 | $7,350 | $0 | $7,350 |
| 2014 | $1,062 | $4,200 | $0 | $4,200 |
Source: Public Records
Map
Nearby Homes
- 201 77th Ave N Unit 23
- 201 77th Ave N Unit 926
- 201 77th Ave N Unit 322
- 201 77th Ave N Unit 1133 Grande Sh
- 201 77th Ave N Unit 828
- 201 77th Ave N Unit 821
- 200 76th Ave N Unit 307 Carolina Winds
- 200 76th Ave N Unit 705
- 200 76th Ave N Unit 6602
- 200 76th Ave N Unit 1106 Carolina Winds
- 200 76th Ave N Unit 301
- 200 76th Ave N Unit 408
- 200 76th Ave N Unit 1009
- 200 76th Ave N Unit Carolina Winds 1211
- 200 76th Ave N Unit 510
- 200 76th Ave N Unit 511
- 215 77th Ave N Unit 603
- 215 77th Ave N Unit 501
- 215 77th Ave N Unit 807
- 212 78th Ave N
- 201 77th Ave N Unit PH31
- 201 77th Ave N Unit 1035
- 201 77th Ave N Unit PH 38
- 201 77th Ave N Unit PH31
- 201 77th Ave N Unit Grande Shores Resort
- 201 77th Ave N Unit Grande Shores 724
- 201 77th Ave N Unit Grande Shores 820
- 201 77th Ave N Unit 1132 Grande Shores
- 201 77th Ave N Unit Grande Shores 1137
- 201 77th Ave N Unit Grande Shores PH 22
- 201 77th Ave N Unit PH 32 GRANDE SHORES
- 201 77th Ave N Unit 420 GRANDE SHORES
- 201 77th Ave N Unit PH 22 GRANDE SHORES
- 201 77th Ave N Unit 1129 GRANDE SHORES
- 201 77avenue N
- 201 77th Ave N Unit Grande Shores 1034
- 201 77th Ave N Unit Grande Shores unit 1
- 201 77th Ave N Unit Grande Shores Unit 3
- 201 77th Ave N Unit Grande Shores Unit 4
- 201 77th Ave N Unit 101 Grande Shores