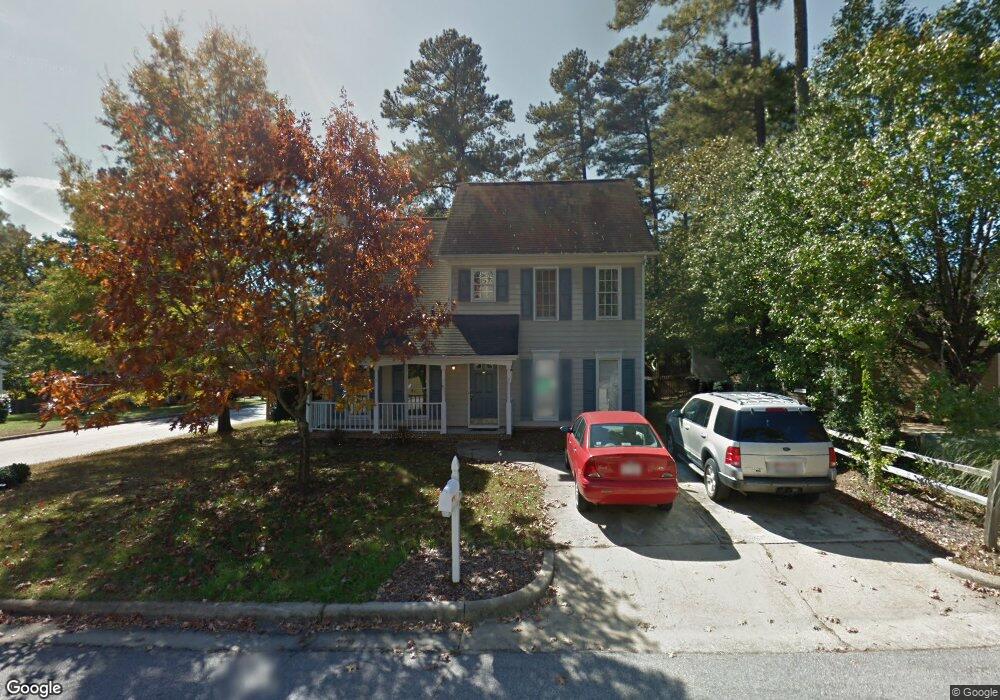
201 Arvo Ln Cary, NC 27513
West Cary NeighborhoodEstimated Value: $429,000 - $453,000
3
Beds
3
Baths
1,700
Sq Ft
$260/Sq Ft
Est. Value
About This Home
This home is located at 201 Arvo Ln, Cary, NC 27513 and is currently estimated at $441,175, approximately $259 per square foot. 201 Arvo Ln is a home located in Wake County with nearby schools including Laurel Park Elementary, Salem Middle, and Green Hope High.
Ownership History
Date
Name
Owned For
Owner Type
Purchase Details
Closed on
Aug 10, 2010
Sold by
Kralik Kenneth J and Kralik Lisa M
Bought by
Hayden Matthew and Hayden Lauren
Current Estimated Value
Home Financials for this Owner
Home Financials are based on the most recent Mortgage that was taken out on this home.
Original Mortgage
$177,509
Outstanding Balance
$117,113
Interest Rate
4.5%
Mortgage Type
FHA
Estimated Equity
$324,062
Purchase Details
Closed on
Jul 27, 2001
Sold by
Walls Robert R and Walls Dawn M
Bought by
Kralik Kenneth J and Kralik Lisa M
Home Financials for this Owner
Home Financials are based on the most recent Mortgage that was taken out on this home.
Original Mortgage
$147,831
Interest Rate
7.08%
Mortgage Type
FHA
Purchase Details
Closed on
Jun 25, 2001
Sold by
Weatherstone Ltd Partnership
Bought by
Chang Dohyun and Chang Rondy
Home Financials for this Owner
Home Financials are based on the most recent Mortgage that was taken out on this home.
Original Mortgage
$147,831
Interest Rate
7.08%
Mortgage Type
FHA
Create a Home Valuation Report for This Property
The Home Valuation Report is an in-depth analysis detailing your home's value as well as a comparison with similar homes in the area
Home Values in the Area
Average Home Value in this Area
Purchase History
| Date | Buyer | Sale Price | Title Company |
|---|---|---|---|
| Hayden Matthew | $180,000 | None Available | |
| Kralik Kenneth J | $149,000 | -- | |
| Chang Dohyun | $330,000 | -- |
Source: Public Records
Mortgage History
| Date | Status | Borrower | Loan Amount |
|---|---|---|---|
| Open | Hayden Matthew | $177,509 | |
| Previous Owner | Kralik Kenneth J | $147,831 | |
| Previous Owner | Chang Dohyun | $247,000 |
Source: Public Records
Tax History Compared to Growth
Tax History
| Year | Tax Paid | Tax Assessment Tax Assessment Total Assessment is a certain percentage of the fair market value that is determined by local assessors to be the total taxable value of land and additions on the property. | Land | Improvement |
|---|---|---|---|---|
| 2025 | $3,568 | $413,996 | $165,000 | $248,996 |
| 2024 | $3,491 | $413,996 | $165,000 | $248,996 |
| 2023 | $2,698 | $267,234 | $90,000 | $177,234 |
| 2022 | $2,597 | $267,234 | $90,000 | $177,234 |
| 2021 | $2,545 | $267,234 | $90,000 | $177,234 |
| 2020 | $2,559 | $267,234 | $90,000 | $177,234 |
| 2019 | $2,292 | $212,208 | $76,000 | $136,208 |
| 2018 | $2,151 | $212,208 | $76,000 | $136,208 |
| 2017 | $2,068 | $212,208 | $76,000 | $136,208 |
| 2016 | $2,037 | $212,208 | $76,000 | $136,208 |
| 2015 | $1,843 | $185,150 | $56,000 | $129,150 |
| 2014 | $1,738 | $185,150 | $56,000 | $129,150 |
Source: Public Records
Map
Nearby Homes
- 102 Korbel Place
- 115 Romaine Ct
- 215 Pointe Crest Ct
- 308 Wax Myrtle Ct
- 224 Amberglow Place
- 226 Amberglow Place
- 114 Colchis Ct
- 121 London Plain Ct
- 105 Whitlock Ln
- 109 Gatepost Ln
- 104 Whitlock Ln
- 113 Ravenna Way
- 105 Queens Knoll Ct
- 103 Javelin Ct
- 116 Lost Tree Ln
- 316 Trafalgar Ln
- 1016 Kilarney Ridge Loop
- 126 Hidden Bluff Ln
- 217 Marilyn Cir
- 209 Smokemont Dr