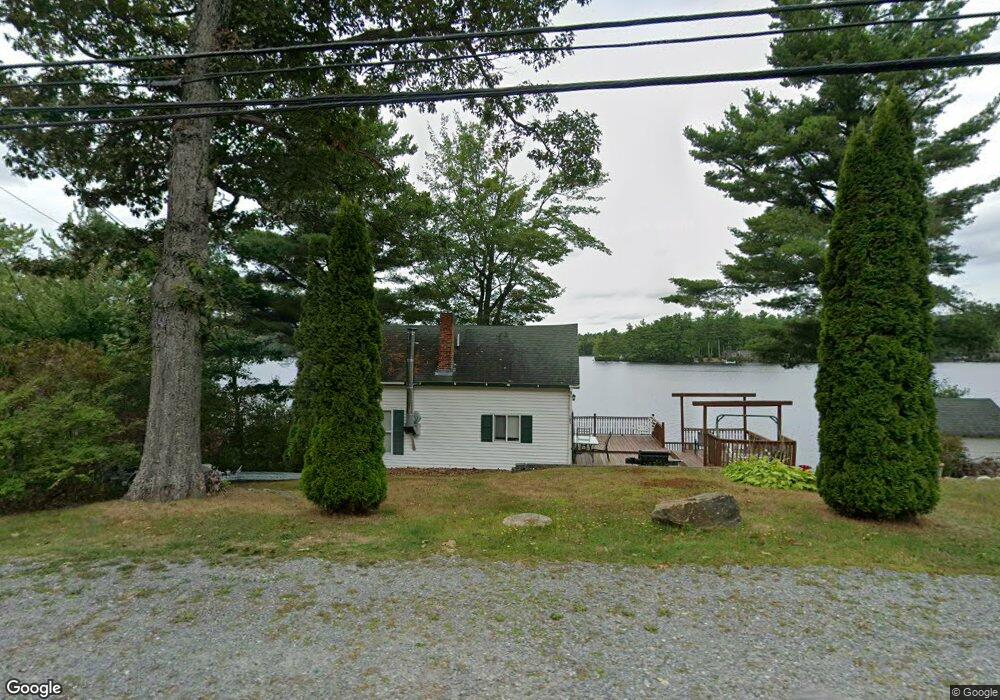
201 Ashby Rd Ashburnham, MA 01430
Estimated Value: $310,186 - $393,000
2
Beds
1
Bath
742
Sq Ft
$478/Sq Ft
Est. Value
About This Home
This home is located at 201 Ashby Rd, Ashburnham, MA 01430 and is currently estimated at $354,547, approximately $477 per square foot. 201 Ashby Rd is a home located in Worcester County with nearby schools including Oakmont Regional High School and Cushing Academy.
Ownership History
Date
Name
Owned For
Owner Type
Purchase Details
Closed on
Apr 19, 2002
Sold by
Kaddy Kristopher R and Kaddy Judith A
Bought by
Crete Jason E and Crete Barabra H
Current Estimated Value
Home Financials for this Owner
Home Financials are based on the most recent Mortgage that was taken out on this home.
Original Mortgage
$115,000
Outstanding Balance
$47,809
Interest Rate
6.85%
Mortgage Type
Purchase Money Mortgage
Estimated Equity
$306,738
Purchase Details
Closed on
Dec 27, 1996
Sold by
Wirkkala Lena Eleanor
Bought by
Kaddy Kristopher R and Kaddy Judith A
Create a Home Valuation Report for This Property
The Home Valuation Report is an in-depth analysis detailing your home's value as well as a comparison with similar homes in the area
Home Values in the Area
Average Home Value in this Area
Purchase History
| Date | Buyer | Sale Price | Title Company |
|---|---|---|---|
| Crete Jason E | $166,000 | -- | |
| Crete Jason E | $166,000 | -- | |
| Kaddy Kristopher R | $62,000 | -- | |
| Kaddy Kristopher R | $62,000 | -- |
Source: Public Records
Mortgage History
| Date | Status | Borrower | Loan Amount |
|---|---|---|---|
| Open | Kaddy Kristopher R | $115,000 | |
| Closed | Kaddy Kristopher R | $115,000 | |
| Previous Owner | Kaddy Kristopher R | $110,000 | |
| Previous Owner | Kaddy Kristopher R | $80,000 |
Source: Public Records
Tax History Compared to Growth
Tax History
| Year | Tax Paid | Tax Assessment Tax Assessment Total Assessment is a certain percentage of the fair market value that is determined by local assessors to be the total taxable value of land and additions on the property. | Land | Improvement |
|---|---|---|---|---|
| 2025 | $3,906 | $262,700 | $122,500 | $140,200 |
| 2024 | $3,906 | $248,000 | $122,500 | $125,500 |
| 2023 | $3,825 | $231,100 | $122,500 | $108,600 |
| 2022 | $3,464 | $183,500 | $104,600 | $78,900 |
| 2021 | $127 | $168,400 | $104,600 | $63,800 |
| 2020 | $0 | $168,400 | $104,600 | $63,800 |
| 2019 | $3,450 | $153,000 | $98,600 | $54,400 |
| 2018 | $5,365 | $145,400 | $93,900 | $51,500 |
| 2017 | $3,432 | $149,400 | $99,100 | $50,300 |
| 2016 | $3,337 | $146,700 | $96,900 | $49,800 |
| 2015 | $3,268 | $146,700 | $96,900 | $49,800 |
Source: Public Records
Map
Nearby Homes