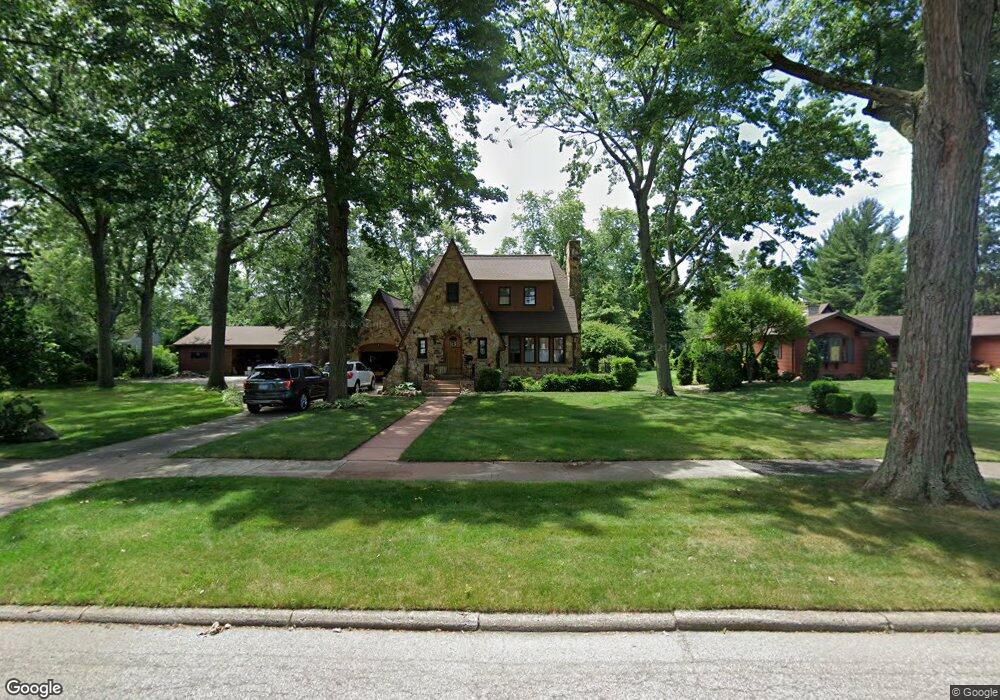
201 Avalon Ct Michigan City, IN 46360
Estimated Value: $273,000 - $302,121
3
Beds
3
Baths
2,188
Sq Ft
$132/Sq Ft
Est. Value
About This Home
This home is located at 201 Avalon Ct, Michigan City, IN 46360 and is currently estimated at $289,780, approximately $132 per square foot. 201 Avalon Ct is a home located in LaPorte County with nearby schools including Edgewood Elementary School, Barker Middle School, and Michigan City High School.
Ownership History
Date
Name
Owned For
Owner Type
Purchase Details
Closed on
Sep 22, 2025
Sold by
Woodland Edward M
Bought by
Edward M Wooland And Sue Ann Woodland Revocab and Woodland
Current Estimated Value
Purchase Details
Closed on
Dec 18, 2018
Sold by
Maguire Kerry J
Bought by
Woodland Edward M
Home Financials for this Owner
Home Financials are based on the most recent Mortgage that was taken out on this home.
Original Mortgage
$89,000
Interest Rate
4.9%
Mortgage Type
New Conventional
Purchase Details
Closed on
Feb 27, 2010
Sold by
Maguire Joan and Maguire Joan W
Bought by
Maguire Joan W and Joan W Maguire Trust
Create a Home Valuation Report for This Property
The Home Valuation Report is an in-depth analysis detailing your home's value as well as a comparison with similar homes in the area
Home Values in the Area
Average Home Value in this Area
Purchase History
| Date | Buyer | Sale Price | Title Company |
|---|---|---|---|
| Edward M Wooland And Sue Ann Woodland Revocab | -- | None Listed On Document | |
| Woodland Edward M | -- | None Available | |
| Maguire Joan W | -- | None Available |
Source: Public Records
Mortgage History
| Date | Status | Borrower | Loan Amount |
|---|---|---|---|
| Previous Owner | Woodland Edward M | $89,000 |
Source: Public Records
Tax History Compared to Growth
Tax History
| Year | Tax Paid | Tax Assessment Tax Assessment Total Assessment is a certain percentage of the fair market value that is determined by local assessors to be the total taxable value of land and additions on the property. | Land | Improvement |
|---|---|---|---|---|
| 2024 | $4,488 | $222,800 | $28,100 | $194,700 |
| 2022 | $3,831 | $195,700 | $28,100 | $167,600 |
| 2021 | $3,831 | $184,700 | $28,100 | $156,600 |
| 2020 | $3,744 | $184,700 | $28,100 | $156,600 |
| 2019 | $3,792 | $180,500 | $27,200 | $153,300 |
| 2018 | $1,872 | $157,800 | $17,400 | $140,400 |
| 2017 | $1,805 | $148,700 | $25,500 | $123,200 |
| 2016 | $1,862 | $153,400 | $25,500 | $127,900 |
| 2014 | $1,844 | $157,800 | $25,600 | $132,200 |
Source: Public Records
Map
Nearby Homes