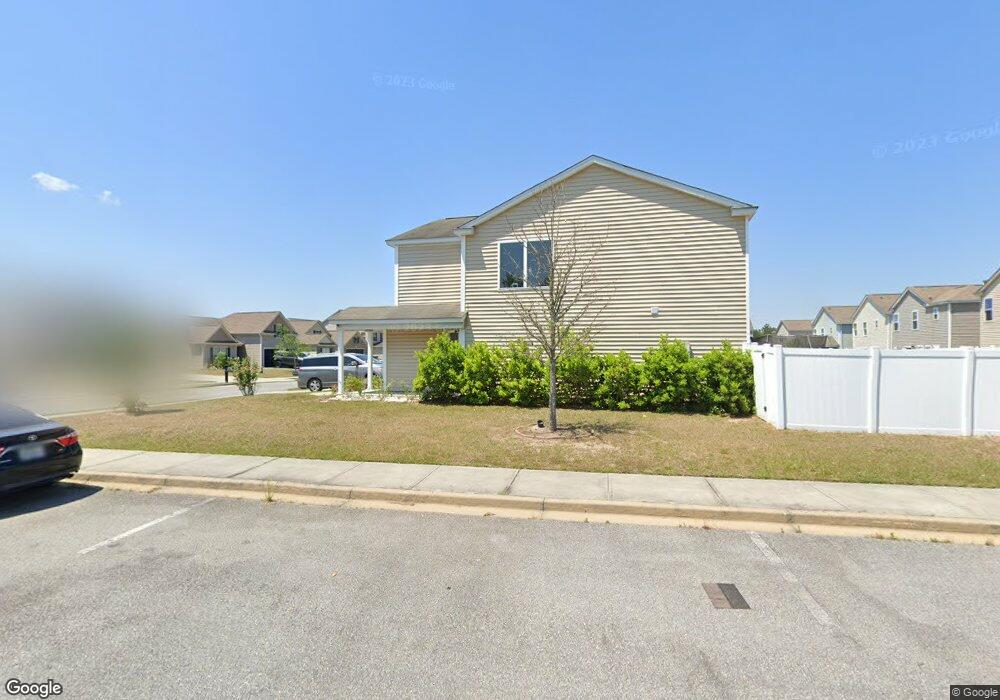
201 Bender St Unit LOT 15 Hinesville, GA 31313
Estimated Value: $280,015 - $294,000
4
Beds
3
Baths
2,158
Sq Ft
$134/Sq Ft
Est. Value
About This Home
This home is located at 201 Bender St Unit LOT 15, Hinesville, GA 31313 and is currently estimated at $290,004, approximately $134 per square foot. 201 Bender St Unit LOT 15 is a home located in Liberty County with nearby schools including Waldo Pafford Elementary School, Lewis Frasier Middle School, and Bradwell Institute.
Ownership History
Date
Name
Owned For
Owner Type
Purchase Details
Closed on
Jun 4, 2019
Sold by
Sahi Stephen
Bought by
Phan Phi H
Current Estimated Value
Home Financials for this Owner
Home Financials are based on the most recent Mortgage that was taken out on this home.
Original Mortgage
$176,719
Outstanding Balance
$155,379
Interest Rate
4.1%
Mortgage Type
VA
Estimated Equity
$134,625
Purchase Details
Closed on
Feb 24, 2011
Sold by
D R Horton Inc
Bought by
Sahi Stephen J and Sahi Heather L
Home Financials for this Owner
Home Financials are based on the most recent Mortgage that was taken out on this home.
Original Mortgage
$169,300
Interest Rate
4.76%
Mortgage Type
VA
Purchase Details
Closed on
Oct 14, 2010
Sold by
Quinnco Marne Llc
Bought by
D R Horton Inc
Purchase Details
Closed on
Oct 13, 2010
Sold by
Independence Settlement Townhome
Bought by
Quinnco Marne Llc
Create a Home Valuation Report for This Property
The Home Valuation Report is an in-depth analysis detailing your home's value as well as a comparison with similar homes in the area
Home Values in the Area
Average Home Value in this Area
Purchase History
| Date | Buyer | Sale Price | Title Company |
|---|---|---|---|
| Phan Phi H | $173,000 | -- | |
| Sahi Stephen J | $165,800 | -- | |
| Sahl Stephen J | $165,760 | -- | |
| D R Horton Inc | -- | -- | |
| Quinnco Marne Llc | -- | -- |
Source: Public Records
Mortgage History
| Date | Status | Borrower | Loan Amount |
|---|---|---|---|
| Open | Phan Phi H | $176,719 | |
| Previous Owner | Sahl Stephen J | $169,300 |
Source: Public Records
Tax History Compared to Growth
Tax History
| Year | Tax Paid | Tax Assessment Tax Assessment Total Assessment is a certain percentage of the fair market value that is determined by local assessors to be the total taxable value of land and additions on the property. | Land | Improvement |
|---|---|---|---|---|
| 2024 | $5,041 | $102,802 | $18,000 | $84,802 |
| 2023 | $5,041 | $90,968 | $16,000 | $74,968 |
| 2022 | $3,608 | $77,621 | $14,400 | $63,221 |
| 2021 | $3,357 | $70,893 | $14,400 | $56,493 |
| 2020 | $3,057 | $63,910 | $12,000 | $51,910 |
| 2019 | $3,060 | $64,462 | $12,000 | $52,462 |
| 2018 | $3,069 | $65,014 | $12,000 | $53,014 |
| 2017 | $2,159 | $65,566 | $12,000 | $53,566 |
| 2016 | $2,974 | $66,119 | $12,000 | $54,119 |
| 2015 | $3,142 | $66,119 | $12,000 | $54,119 |
| 2014 | $3,142 | $69,142 | $12,000 | $57,142 |
| 2013 | -- | $68,212 | $10,000 | $58,212 |
Source: Public Records
Map
Nearby Homes
- 201 Bender St
- 203 Bender St
- 205 Bender St
- 302 Connor Ct Unit LOT 26
- 302 Connor Ct
- 207 Bender St Unit LOT 16
- 207 Bender St
- 200 Bender St
- 202 Bender St
- 306 Connor Ct
- 209 Bender St
- 206 Bender St
- 308 Connor Ct
- 301 Conner Ct
- 101 Davila St
- 103 Davila St
- 301 Connor Ct
- 208 Bender St
- 303 Connor Ct
- 105 Davila St