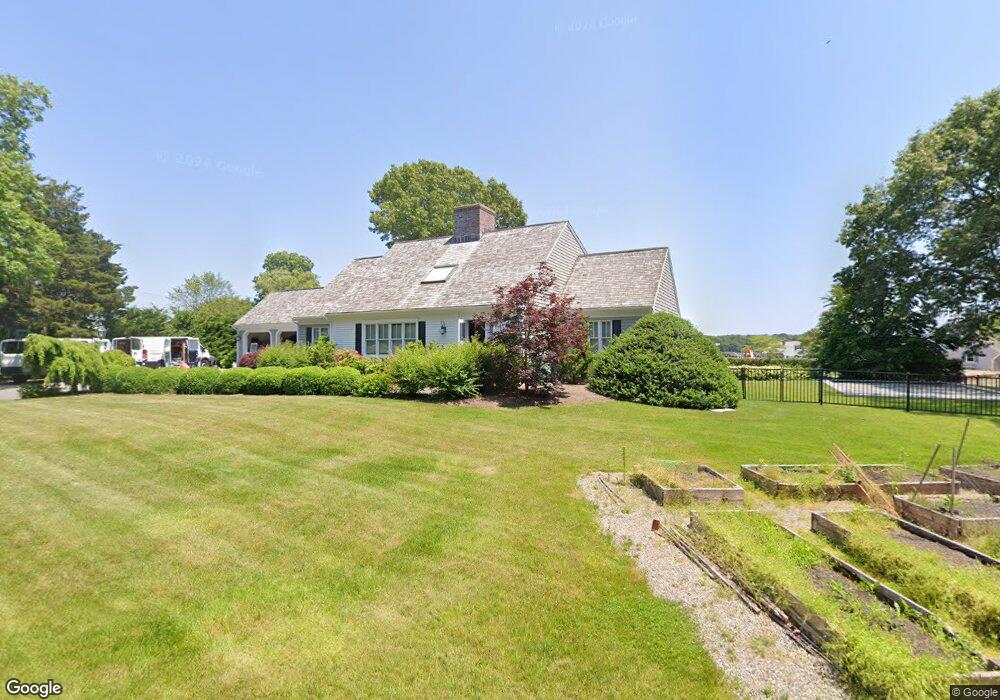
201 Bridge St Osterville, MA 02655
Osterville NeighborhoodEstimated Value: $5,464,000 - $6,765,805
6
Beds
6
Baths
5,059
Sq Ft
$1,169/Sq Ft
Est. Value
About This Home
This home is located at 201 Bridge St, Osterville, MA 02655 and is currently estimated at $5,913,268, approximately $1,168 per square foot. 201 Bridge St is a home located in Barnstable County with nearby schools including West Villages Elementary School, Barnstable United Elementary School, and Barnstable Intermediate School.
Ownership History
Date
Name
Owned For
Owner Type
Purchase Details
Closed on
Dec 21, 2020
Sold by
Ward Eileen M
Bought by
Ward Irt
Current Estimated Value
Purchase Details
Closed on
Dec 11, 1991
Sold by
Donley John J
Bought by
Ward Frances M
Create a Home Valuation Report for This Property
The Home Valuation Report is an in-depth analysis detailing your home's value as well as a comparison with similar homes in the area
Home Values in the Area
Average Home Value in this Area
Purchase History
| Date | Buyer | Sale Price | Title Company |
|---|---|---|---|
| Ward Irt | -- | None Available | |
| Ward Irt | -- | None Available | |
| Ward Frances M | $1,051,000 | -- |
Source: Public Records
Tax History
| Year | Tax Paid | Tax Assessment Tax Assessment Total Assessment is a certain percentage of the fair market value that is determined by local assessors to be the total taxable value of land and additions on the property. | Land | Improvement |
|---|---|---|---|---|
| 2025 | $46,415 | $5,737,300 | $3,547,100 | $2,190,200 |
| 2024 | $43,410 | $5,558,200 | $3,547,100 | $2,011,100 |
| 2023 | $41,255 | $4,946,700 | $3,234,500 | $1,712,200 |
| 2022 | $37,169 | $3,855,700 | $2,424,000 | $1,431,700 |
| 2021 | $34,098 | $3,250,500 | $2,299,700 | $950,800 |
| 2020 | $38,369 | $3,500,800 | $2,623,200 | $877,600 |
| 2019 | $40,675 | $3,605,900 | $2,623,200 | $982,700 |
| 2018 | $38,418 | $3,617,900 | $2,761,200 | $856,700 |
| 2017 | $38,547 | $3,582,400 | $2,761,200 | $821,200 |
| 2016 | $39,072 | $3,584,600 | $2,763,400 | $821,200 |
| 2015 | $37,455 | $3,452,100 | $2,650,700 | $801,400 |
Source: Public Records
Map
Nearby Homes
- 414 Eel
- 168 Garrison Ln
- 67 Fire Station Rd
- 33 Sunset Ln
- 71 Sand Point
- 39 Blossom Ave Unit 4
- 920 Main St Unit 1 Building 2
- 920 Main St Unit 2-1
- 414 Eel River Rd
- 146 Scudder Rd
- 39 Tower Hill Rd Unit 1C
- 39 Tower Hill Rd Unit 18A
- 850 Sea View Ave
- 501 Eel River Rd
- 98 Bunker Hill Rd
- 14 Indian Trail
- Lot 289 Seapuit River B Rd
- Lot 288 Seapuit River A Rd
- 51 Wianno Cir
- 835 Old Post Rd
Your Personal Tour Guide
Ask me questions while you tour the home.