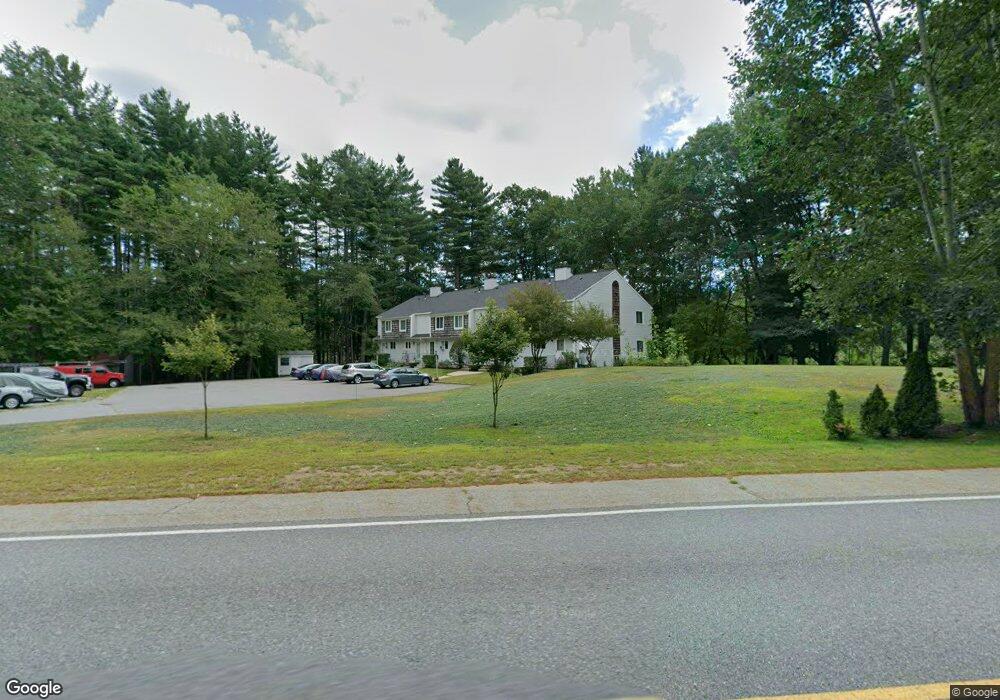
201 Brookline St Unit 4 Townsend, MA 01469
Estimated Value: $273,000 - $366,000
2
Beds
2
Baths
1,172
Sq Ft
$260/Sq Ft
Est. Value
About This Home
This home is located at 201 Brookline St Unit 4, Townsend, MA 01469 and is currently estimated at $305,079, approximately $260 per square foot. 201 Brookline St Unit 4 is a home located in Middlesex County with nearby schools including North Middlesex Regional High School.
Ownership History
Date
Name
Owned For
Owner Type
Purchase Details
Closed on
Oct 29, 1999
Sold by
Dearborn Glenn E and Oconnell Sarah E
Bought by
Macklin Daniel J
Current Estimated Value
Home Financials for this Owner
Home Financials are based on the most recent Mortgage that was taken out on this home.
Original Mortgage
$72,750
Outstanding Balance
$22,261
Interest Rate
7.78%
Mortgage Type
Purchase Money Mortgage
Estimated Equity
$282,818
Purchase Details
Closed on
Dec 31, 1997
Sold by
Gaudet Louise M
Bought by
Dearborn Glenn E and Oconnell Sarah E
Home Financials for this Owner
Home Financials are based on the most recent Mortgage that was taken out on this home.
Original Mortgage
$58,800
Interest Rate
7.11%
Mortgage Type
Purchase Money Mortgage
Create a Home Valuation Report for This Property
The Home Valuation Report is an in-depth analysis detailing your home's value as well as a comparison with similar homes in the area
Home Values in the Area
Average Home Value in this Area
Purchase History
| Date | Buyer | Sale Price | Title Company |
|---|---|---|---|
| Macklin Daniel J | $75,000 | -- | |
| Dearborn Glenn E | $61,900 | -- |
Source: Public Records
Mortgage History
| Date | Status | Borrower | Loan Amount |
|---|---|---|---|
| Open | Dearborn Glenn E | $72,750 | |
| Previous Owner | Dearborn Glenn E | $58,800 | |
| Previous Owner | Dearborn Glenn E | $10,000 |
Source: Public Records
Tax History Compared to Growth
Tax History
| Year | Tax Paid | Tax Assessment Tax Assessment Total Assessment is a certain percentage of the fair market value that is determined by local assessors to be the total taxable value of land and additions on the property. | Land | Improvement |
|---|---|---|---|---|
| 2025 | $2,685 | $184,900 | $0 | $184,900 |
| 2024 | $2,626 | $182,200 | $0 | $182,200 |
| 2023 | $2,472 | $162,000 | $0 | $162,000 |
| 2022 | $2,397 | $136,100 | $0 | $136,100 |
| 2021 | $2,359 | $128,700 | $0 | $128,700 |
| 2020 | $2,249 | $115,200 | $0 | $115,200 |
| 2019 | $2,148 | $111,100 | $0 | $111,100 |
| 2018 | $3,825 | $101,200 | $0 | $101,200 |
| 2017 | $1,934 | $98,300 | $0 | $98,300 |
| 2016 | $1,857 | $93,800 | $0 | $93,800 |
| 2015 | $1,684 | $88,100 | $0 | $88,100 |
| 2014 | $1,973 | $100,800 | $0 | $100,800 |
Source: Public Records
Map
Nearby Homes
- 15 N End Rd
- 364 Townsend Hill Rd
- 6 High Oaks Path
- 46 Oak Hill Rd
- 0 Brookline St
- 7 Winterberry Rd
- 9 Winterberry Rd
- 64 Meadow Rd
- 21 Cranberry St
- 6 Flint Meadow Dr
- 110 Haynes Rd
- 91 Highland St
- 1235 Townsend Rd
- 179 Brookline St
- 10 Boynton St
- 167 Route 13
- 28A Rocky Pond Rd
- 143 Worcester Rd
- 1 Depot Street Extension Unit 5
- 1 Depot Street Extension Unit 2
- 201 Brookline St Unit 6
- 201 Brookline St Unit 5
- 201 Brookline St Unit 3
- 201 Brookline St Unit 2
- 201 Brookline St Unit 1
- 201 Brookline St Unit END
- 00 Route 13
- 3 Barnaby Way
- 3 Route 13
- 2 Laurel Crest Dr
- 2 Laurel Crest Dr
- 1 Laurel Crest Dr
- 4 Captain Douglas Dr
- 4 Captain Douglas Dr
- 4 Laurel Crest Dr
- 10 Route 13
- 6 Laurel Crest Dr
- 5 Captain Douglas Dr
- 5 Captain Douglas Dr
- 23 Route 13