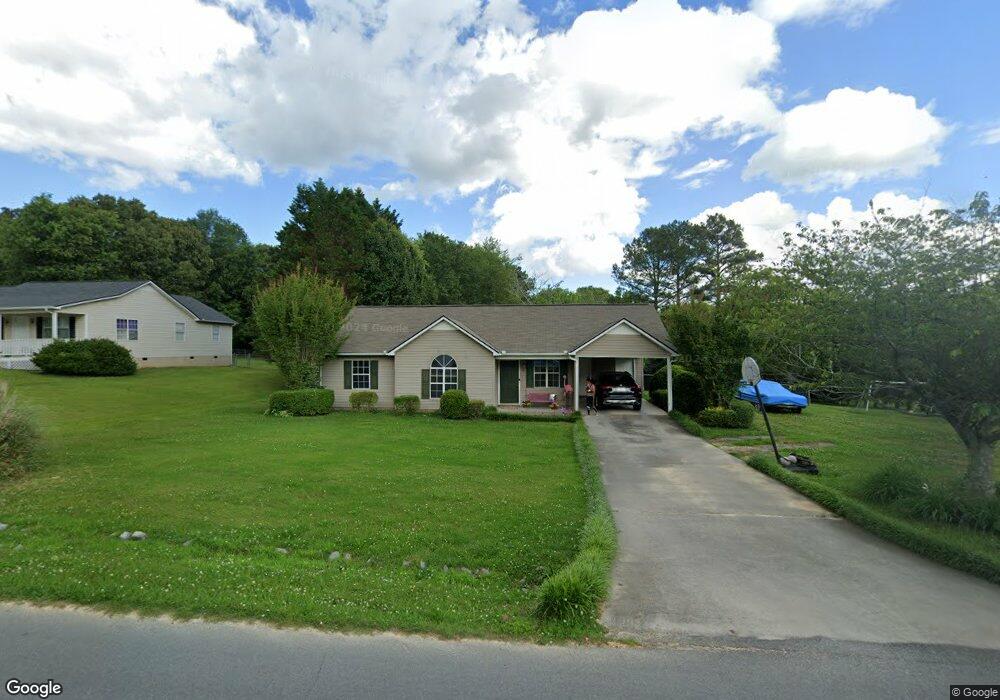
201 Buck Blvd SE Calhoun, GA 30701
Estimated Value: $210,000 - $224,000
3
Beds
2
Baths
1,165
Sq Ft
$187/Sq Ft
Est. Value
About This Home
This home is located at 201 Buck Blvd SE, Calhoun, GA 30701 and is currently estimated at $217,868, approximately $187 per square foot. 201 Buck Blvd SE is a home located in Gordon County with nearby schools including Red Bud Elementary School, Red Bud Middle School, and Sonoraville High School.
Ownership History
Date
Name
Owned For
Owner Type
Purchase Details
Closed on
Jun 25, 2007
Sold by
Harris Darrel
Bought by
Harris Darrel and Harris Vanya
Current Estimated Value
Home Financials for this Owner
Home Financials are based on the most recent Mortgage that was taken out on this home.
Original Mortgage
$110,635
Outstanding Balance
$67,954
Interest Rate
6.35%
Mortgage Type
FHA
Estimated Equity
$149,914
Purchase Details
Closed on
Jun 27, 2005
Sold by
Harris Darrel
Bought by
Harris Darrel and Harris Vanya
Purchase Details
Closed on
May 20, 2003
Sold by
Home Mart Builders Inc
Bought by
Frix Chris W
Purchase Details
Closed on
Jan 31, 2002
Sold by
Worley William M and Tammy Lee
Bought by
Home Mart Builders Inc
Purchase Details
Closed on
Oct 24, 1994
Bought by
Worley William M and Tammy Lee
Purchase Details
Closed on
Jun 14, 1994
Bought by
Dixon Larriann L
Purchase Details
Closed on
Dec 21, 1993
Bought by
Stocks Bruce
Create a Home Valuation Report for This Property
The Home Valuation Report is an in-depth analysis detailing your home's value as well as a comparison with similar homes in the area
Home Values in the Area
Average Home Value in this Area
Purchase History
| Date | Buyer | Sale Price | Title Company |
|---|---|---|---|
| Harris Darrel | -- | -- | |
| Harris Darrel | -- | -- | |
| Harris Darrel | -- | -- | |
| Frix Chris W | -- | -- | |
| Home Mart Builders Inc | $69,000 | -- | |
| Worley William M | $62,400 | -- | |
| Dixon Larriann L | $7,500 | -- | |
| Stocks Bruce | -- | -- |
Source: Public Records
Mortgage History
| Date | Status | Borrower | Loan Amount |
|---|---|---|---|
| Open | Harris Darrel | $110,635 |
Source: Public Records
Tax History Compared to Growth
Tax History
| Year | Tax Paid | Tax Assessment Tax Assessment Total Assessment is a certain percentage of the fair market value that is determined by local assessors to be the total taxable value of land and additions on the property. | Land | Improvement |
|---|---|---|---|---|
| 2024 | $1,529 | $60,192 | $6,440 | $53,752 |
| 2023 | $1,433 | $56,396 | $6,440 | $49,956 |
| 2022 | $1,425 | $52,764 | $6,440 | $46,324 |
| 2021 | $1,214 | $43,316 | $6,440 | $36,876 |
| 2020 | $1,145 | $39,948 | $5,880 | $34,068 |
| 2019 | $1,151 | $39,948 | $5,880 | $34,068 |
| 2018 | $959 | $33,296 | $5,040 | $28,256 |
| 2017 | $937 | $31,616 | $5,040 | $26,576 |
| 2016 | $848 | $28,564 | $4,760 | $23,804 |
| 2015 | $841 | $28,044 | $4,760 | $23,284 |
| 2014 | $688 | $23,620 | $4,200 | $19,420 |
Source: Public Records
Map
Nearby Homes
- 0 Buck Blvd SE Unit 7362017
- 0 Buck Blvd SE Unit 10275210
- 4134 Dews Pond Rd SE
- 177 Frix Ln SE
- 191 Frix Ln SE
- 408 Peachtree Ln SE
- 192 Cardinal Blvd SE
- 194 Cardinal Blvd SE
- 0 Libby Ln SE Unit 10275212
- 0 Libby Ln SE Unit 7362041
- 137 Hunters Trail SE
- 0 Covington Bridge Rd SE Unit 10558075
- 0 Covington Bridge Rd SE Unit 7610123
- 00002 Lovebridge Rd SE
- lot 4 Lovebridge Rd SE
- 127 Alex Ct
- 0 Hunts Gin Rd L2
- 702 Cash Rd SE
- 187 Willow Haven St SE
- 170 Willow Haven St SE
- 211 Buck Blvd SE
- 191 Buck Blvd SE
- 221 Buck Blvd SE
- 173 Buck Blvd SE
- 190 Buck Blvd SE
- 180 Buck Blvd SE
- 170 Buck Blvd SE
- 231 Buck Blvd SE
- 101 Doe Ln SE
- 171 Buck Blvd SE
- 789 Buck Blvd SE
- 799 Buck Blvd SE
- 118 Doe Ln SE
- 809 Buck Blvd SE
- 779 Buck Blvd SE
- 241 Buck Blvd SE
- 101 Deer Run Trail SE
- 819 Buck Blvd SE
- 161 Buck Blvd SE
- 210 Buck Blvd SE