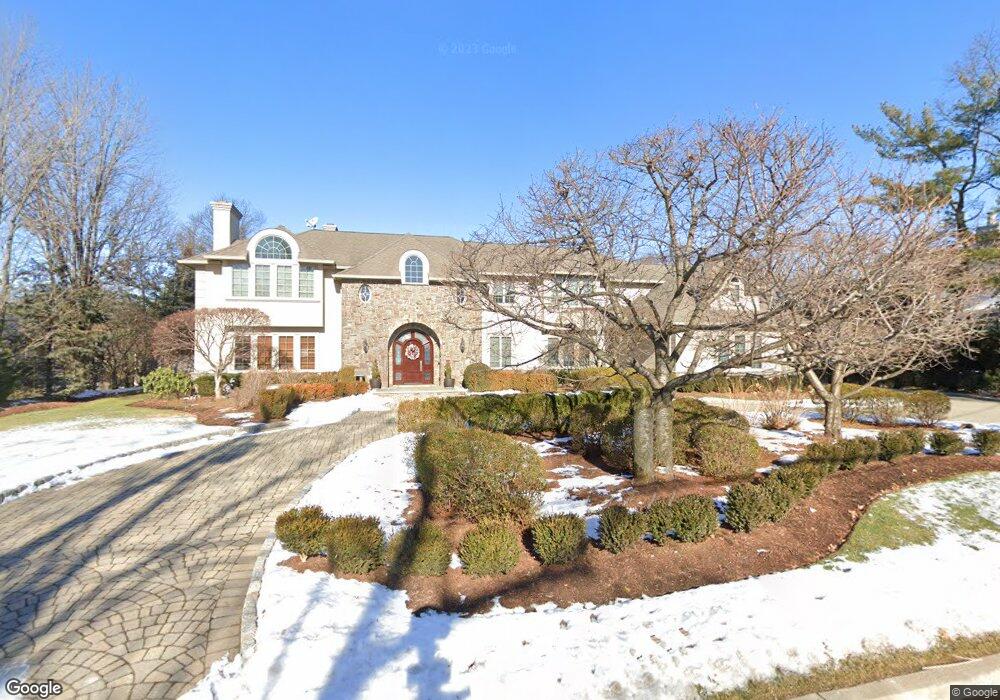
201 Buckingham Rd Tenafly, NJ 07670
Estimated Value: $3,819,722 - $4,717,000
--
Bed
--
Bath
5,849
Sq Ft
$732/Sq Ft
Est. Value
About This Home
This home is located at 201 Buckingham Rd, Tenafly, NJ 07670 and is currently estimated at $4,281,907, approximately $732 per square foot. 201 Buckingham Rd is a home located in Bergen County with nearby schools including Tenafly Middle School, Tenafly High School, and The Elisabeth Morrow School.
Ownership History
Date
Name
Owned For
Owner Type
Purchase Details
Closed on
Aug 11, 2002
Sold by
Spring Hill Assoc Llc
Bought by
Couri George
Current Estimated Value
Home Financials for this Owner
Home Financials are based on the most recent Mortgage that was taken out on this home.
Original Mortgage
$1,000,000
Outstanding Balance
$423,754
Interest Rate
6.57%
Estimated Equity
$3,858,153
Purchase Details
Closed on
Sep 29, 2000
Sold by
Friedland Michael
Bought by
Springhill Assoc Llc
Create a Home Valuation Report for This Property
The Home Valuation Report is an in-depth analysis detailing your home's value as well as a comparison with similar homes in the area
Home Values in the Area
Average Home Value in this Area
Purchase History
| Date | Buyer | Sale Price | Title Company |
|---|---|---|---|
| Couri George | $2,283,500 | -- | |
| Springhill Assoc Llc | $775,000 | -- | |
| Springhill Assoc Llc | $775,000 | -- |
Source: Public Records
Mortgage History
| Date | Status | Borrower | Loan Amount |
|---|---|---|---|
| Open | Couri George | $1,000,000 |
Source: Public Records
Tax History Compared to Growth
Tax History
| Year | Tax Paid | Tax Assessment Tax Assessment Total Assessment is a certain percentage of the fair market value that is determined by local assessors to be the total taxable value of land and additions on the property. | Land | Improvement |
|---|---|---|---|---|
| 2025 | $61,082 | $2,150,000 | $1,092,000 | $1,058,000 |
| 2024 | $59,598 | $2,150,000 | $1,092,000 | $1,058,000 |
| 2023 | $58,158 | $2,150,000 | $1,092,000 | $1,058,000 |
| 2022 | $58,158 | $2,150,000 | $1,092,000 | $1,058,000 |
| 2021 | $57,126 | $2,150,000 | $1,092,000 | $1,058,000 |
| 2020 | $56,287 | $2,150,000 | $1,092,000 | $1,058,000 |
| 2019 | $59,027 | $2,295,000 | $1,092,000 | $1,203,000 |
| 2018 | $58,109 | $2,295,000 | $1,092,000 | $1,203,000 |
| 2017 | $57,903 | $2,295,000 | $1,092,000 | $1,203,000 |
| 2016 | $56,755 | $2,295,000 | $1,092,000 | $1,203,000 |
| 2015 | $55,493 | $2,295,000 | $1,092,000 | $1,203,000 |
| 2014 | $54,460 | $2,295,000 | $1,092,000 | $1,203,000 |
Source: Public Records
Map
Nearby Homes
- 213 Buckingham Rd
- 187 Buckingham Rd
- 104 Kent Rd
- 225 Buckingham Rd
- 198 Buckingham Rd
- 175 Buckingham Rd
- 92 Kent Rd
- 116 Kent Rd
- 188 Buckingham Rd
- 128 Kent Rd
- 82 Kent Rd
- 220 Buckingham Rd
- 176 Buckingham Rd
- 235 Buckingham Rd
- 18 Essex Dr
- 234 Buckingham Rd
- 159 Buckingham Rd
- 140 Kent Rd
- 109 Kent Rd
- 97 Kent Rd