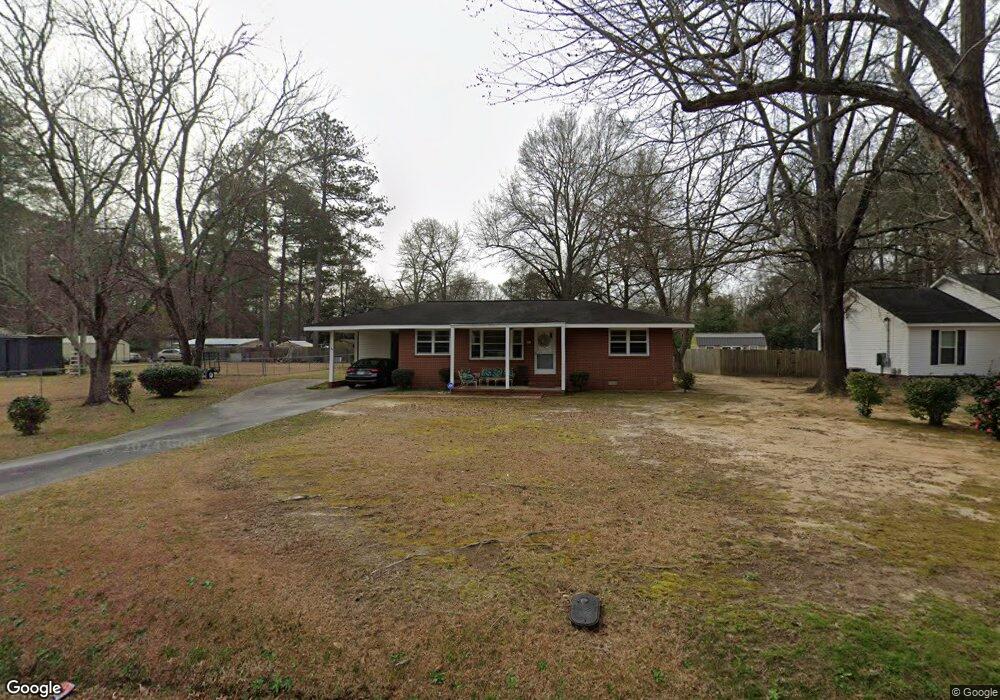
201 Carroll St Thomson, GA 30824
Estimated Value: $126,000 - $147,000
3
Beds
1
Bath
1,092
Sq Ft
$123/Sq Ft
Est. Value
About This Home
This home is located at 201 Carroll St, Thomson, GA 30824 and is currently estimated at $133,787, approximately $122 per square foot. 201 Carroll St is a home located in McDuffie County with nearby schools including Thomson High School.
Ownership History
Date
Name
Owned For
Owner Type
Purchase Details
Closed on
Dec 22, 2016
Sold by
Will
Bought by
Burnett Will and Burnett Susie Mae
Current Estimated Value
Purchase Details
Closed on
May 15, 2006
Sold by
Jones Annie Florence Mccor
Bought by
Wilson Steve
Purchase Details
Closed on
Feb 13, 2006
Sold by
Jones Annie
Bought by
Marsh Bernice H
Purchase Details
Closed on
Feb 8, 2006
Sold by
Gunter Marilyn
Bought by
Jones Annie
Purchase Details
Closed on
Sep 9, 1959
Bought by
Jones Jones C and Jones Annie M
Create a Home Valuation Report for This Property
The Home Valuation Report is an in-depth analysis detailing your home's value as well as a comparison with similar homes in the area
Home Values in the Area
Average Home Value in this Area
Purchase History
| Date | Buyer | Sale Price | Title Company |
|---|---|---|---|
| Burnett Will | -- | -- | |
| Burnett Will | $78,000 | -- | |
| Wilson Steve | $18,000 | -- | |
| Mccorkle Jones Annie Florence | -- | -- | |
| Marsh Bernice H | $78,000 | -- | |
| Jones Annie | -- | -- | |
| Jones Jones C | -- | -- |
Source: Public Records
Tax History Compared to Growth
Tax History
| Year | Tax Paid | Tax Assessment Tax Assessment Total Assessment is a certain percentage of the fair market value that is determined by local assessors to be the total taxable value of land and additions on the property. | Land | Improvement |
|---|---|---|---|---|
| 2025 | $718 | $42,436 | $2,928 | $39,508 |
| 2024 | $718 | $40,233 | $2,528 | $37,705 |
| 2023 | $688 | $38,581 | $2,400 | $36,181 |
| 2022 | $471 | $32,820 | $1,600 | $31,220 |
| 2021 | $310 | $26,733 | $1,600 | $25,133 |
| 2020 | $265 | $25,503 | $6,374 | $19,129 |
| 2019 | $313 | $28,382 | $6,374 | $22,008 |
| 2018 | $318 | $28,382 | $6,374 | $22,008 |
| 2017 | $305 | $28,382 | $6,374 | $22,008 |
| 2016 | $1,086 | $31,016 | $6,374 | $24,642 |
| 2015 | $963 | $31,016 | $6,374 | $24,642 |
| 2014 | $987 | $31,673 | $6,374 | $25,299 |
| 2013 | -- | $31,673 | $6,374 | $25,298 |
Source: Public Records
Map
Nearby Homes
- 125 Carroll St
- 207 Carroll St
- 0 Carroll St
- 202 Carroll St
- 206 Lynda Ln
- 115 Carroll St
- 118 Lynda Ln
- 805 Pine Lane Dr
- 206 Carroll St
- 811 Pine Lane Dr
- 717 Pine Lane Dr
- 114 Carroll St
- 110 Carroll St
- 300 Michael St
- 121 Lynda Ln
- 209 Lynda Ln
- 808 Jackson St
- 819 Pine Lane Dr
- 720 Pine Lane Dr
- 714 Pine Lane Dr