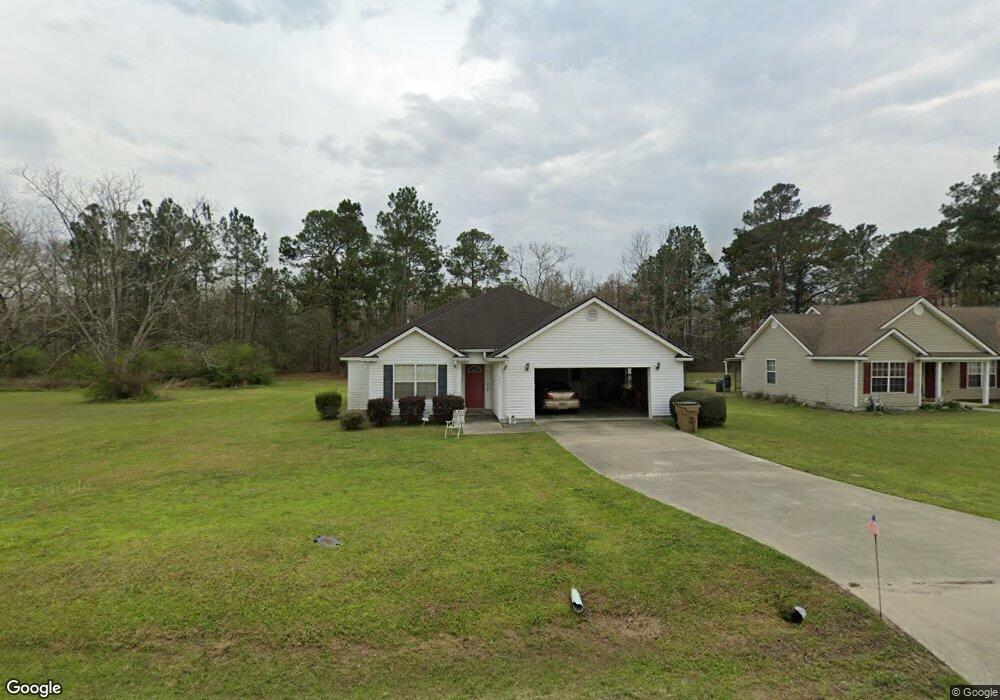
201 Charles St Sparks, GA 31647
Estimated Value: $175,000 - $250,000
3
Beds
2
Baths
1,666
Sq Ft
$131/Sq Ft
Est. Value
About This Home
This home is located at 201 Charles St, Sparks, GA 31647 and is currently estimated at $217,463, approximately $130 per square foot. 201 Charles St is a home located in Cook County with nearby schools including Cook Primary School, Cook Elementary School, and Cook County Middle School.
Ownership History
Date
Name
Owned For
Owner Type
Purchase Details
Closed on
Jan 21, 2016
Sold by
Stephens Mildred W
Bought by
Stephens Mildred W and Stephens Michael R
Current Estimated Value
Purchase Details
Closed on
Jul 29, 2015
Sold by
Betts Kevin B
Bought by
Stephens Mildred W
Purchase Details
Closed on
Jun 28, 2011
Sold by
Homesales Inc
Bought by
Betts Kevin B
Home Financials for this Owner
Home Financials are based on the most recent Mortgage that was taken out on this home.
Original Mortgage
$61,200
Interest Rate
4.57%
Mortgage Type
New Conventional
Purchase Details
Closed on
Jun 23, 2011
Sold by
Jpmorgan Chase Bank Na
Bought by
Homesales Inc
Home Financials for this Owner
Home Financials are based on the most recent Mortgage that was taken out on this home.
Original Mortgage
$61,200
Interest Rate
4.57%
Mortgage Type
New Conventional
Purchase Details
Closed on
Nov 2, 2010
Sold by
Weathers Troy J
Bought by
Chase Home Finance Llc
Create a Home Valuation Report for This Property
The Home Valuation Report is an in-depth analysis detailing your home's value as well as a comparison with similar homes in the area
Home Values in the Area
Average Home Value in this Area
Purchase History
| Date | Buyer | Sale Price | Title Company |
|---|---|---|---|
| Stephens Mildred W | -- | -- | |
| Stephens Mildred W | $125,000 | -- | |
| Betts Kevin B | $76,500 | -- | |
| Homesales Inc | -- | -- | |
| Chase Home Finance Llc | $79,900 | -- |
Source: Public Records
Mortgage History
| Date | Status | Borrower | Loan Amount |
|---|---|---|---|
| Previous Owner | Betts Kevin B | $61,200 | |
| Previous Owner | Homesales Inc | $61,200 |
Source: Public Records
Tax History Compared to Growth
Tax History
| Year | Tax Paid | Tax Assessment Tax Assessment Total Assessment is a certain percentage of the fair market value that is determined by local assessors to be the total taxable value of land and additions on the property. | Land | Improvement |
|---|---|---|---|---|
| 2024 | $1,954 | $57,346 | $4,351 | $52,995 |
| 2023 | $657 | $49,752 | $3,885 | $45,867 |
| 2022 | $1,142 | $49,752 | $3,885 | $45,867 |
| 2021 | $985 | $41,634 | $3,885 | $37,749 |
| 2020 | $985 | $41,634 | $3,885 | $37,749 |
| 2019 | $985 | $41,634 | $3,885 | $37,749 |
| 2018 | $1,525 | $41,634 | $3,885 | $37,749 |
| 2017 | $986 | $41,634 | $3,885 | $37,749 |
| 2016 | $988 | $41,634 | $3,885 | $37,749 |
| 2015 | $1,066 | $36,744 | $1,852 | $34,893 |
| 2014 | $1,068 | $36,744 | $1,852 | $34,893 |
| 2013 | -- | $36,744 | $1,851 | $34,892 |
Source: Public Records
Map
Nearby Homes
- 103 N College St
- 134 Brandy Ct
- 284 Barrett Rd
- 105 Orchard Cir
- 120 Westover Dr
- 123 Westover Dr
- 2302 Thomas St
- 2603 Dianne St
- 2503 Dianne St
- 4711 Highway 37
- 1402 Bear Creek Rd
- 1306 Bear Creek Rd
- 0 Barneyville Rd
- 701 Gloria St
- 304 E 3rd St
- 315 Newton Dr
- 418 E 3rd St
- 137 Hood Dr
- 625 Coxstill Rd
- 515 John Keigans Memorial