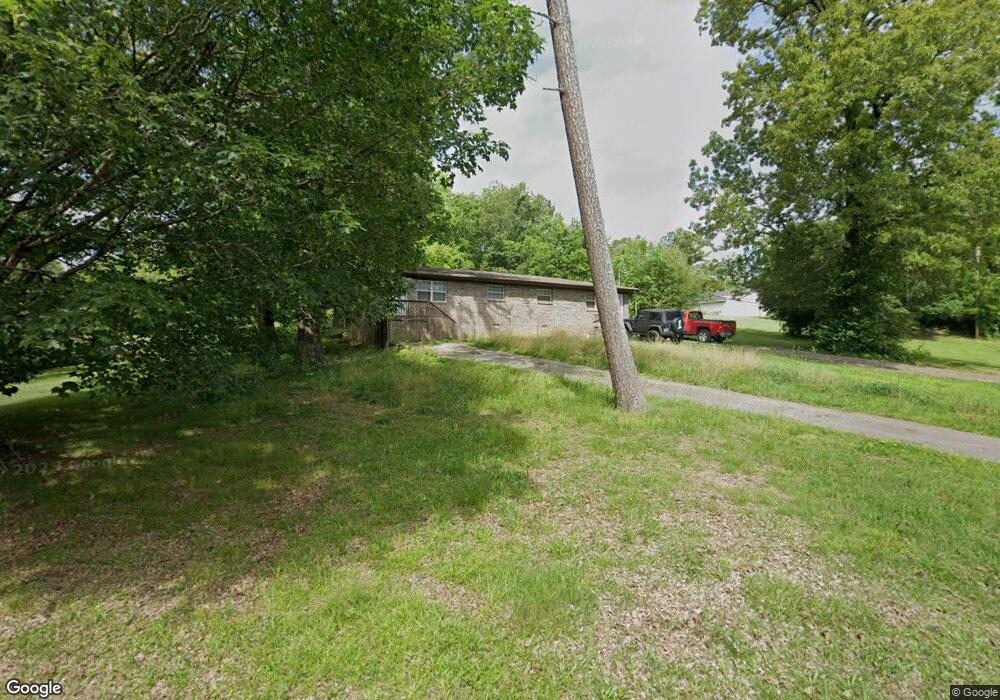
201 Chestnut St Unit 1 Rossville, GA 30741
Lakeview NeighborhoodEstimated Value: $188,000 - $273,000
--
Bed
2
Baths
1,529
Sq Ft
$142/Sq Ft
Est. Value
About This Home
This home is located at 201 Chestnut St Unit 1, Rossville, GA 30741 and is currently estimated at $217,610, approximately $142 per square foot. 201 Chestnut St Unit 1 is a home located in Catoosa County with nearby schools including Cloud Springs Elementary School, Lakeview Middle School, and Lakeview-Fort Oglethorpe High School.
Ownership History
Date
Name
Owned For
Owner Type
Purchase Details
Closed on
Jun 14, 2023
Sold by
High Point Homes Llc
Bought by
Mcgivern Thomas
Current Estimated Value
Home Financials for this Owner
Home Financials are based on the most recent Mortgage that was taken out on this home.
Original Mortgage
$138,000
Interest Rate
6.39%
Mortgage Type
New Conventional
Purchase Details
Closed on
Mar 31, 2020
Sold by
Judge Vernon L
Bought by
High Point Homes Llc
Home Financials for this Owner
Home Financials are based on the most recent Mortgage that was taken out on this home.
Original Mortgage
$42,500
Interest Rate
3.2%
Mortgage Type
New Conventional
Purchase Details
Closed on
Jul 28, 1986
Bought by
Judge Vernon L and Judge Wf
Create a Home Valuation Report for This Property
The Home Valuation Report is an in-depth analysis detailing your home's value as well as a comparison with similar homes in the area
Home Values in the Area
Average Home Value in this Area
Purchase History
| Date | Buyer | Sale Price | Title Company |
|---|---|---|---|
| Mcgivern Thomas | $195,000 | -- | |
| High Point Homes Llc | $50,000 | -- | |
| Judge Vernon L | $37,000 | -- |
Source: Public Records
Mortgage History
| Date | Status | Borrower | Loan Amount |
|---|---|---|---|
| Closed | Mcgivern Thomas | $138,000 | |
| Previous Owner | High Point Homes Llc | $42,500 |
Source: Public Records
Tax History Compared to Growth
Tax History
| Year | Tax Paid | Tax Assessment Tax Assessment Total Assessment is a certain percentage of the fair market value that is determined by local assessors to be the total taxable value of land and additions on the property. | Land | Improvement |
|---|---|---|---|---|
| 2024 | $1,589 | $77,375 | $8,002 | $69,373 |
| 2023 | $989 | $44,189 | $8,002 | $36,187 |
| 2022 | $797 | $35,596 | $8,002 | $27,594 |
| 2021 | $418 | $35,596 | $8,002 | $27,594 |
| 2020 | $626 | $27,036 | $6,858 | $20,178 |
| 2019 | $632 | $27,036 | $6,858 | $20,178 |
| 2018 | $668 | $27,036 | $6,858 | $20,178 |
| 2017 | $707 | $28,631 | $6,858 | $21,773 |
| 2016 | $692 | $26,622 | $6,858 | $19,763 |
| 2015 | -- | $26,622 | $6,858 | $19,763 |
| 2014 | -- | $26,622 | $6,858 | $19,763 |
| 2013 | -- | $26,621 | $6,858 | $19,763 |
Source: Public Records
Map
Nearby Homes
- 201-203 Chestnut St
- 153 Grove St
- 195 S Elmwood St
- 177 Magnolia St
- 418 Warren St
- 394 School St
- 268 Lawrence Dr
- 155 Warren St
- 65 Nason St
- 1003 Magnolia St
- 455 Warren St
- 925 Magnolia St
- 385 Cross St
- 214 Park St
- 216 Catoosa St
- 213 Alabama Ave
- 62 Parkett St
- 232 Greenfield Dr
- 202 Tennessee Ave
- 1149 Lakeview Dr
- 201 Chestnut St
- 1113 Chestnut St
- 227 Chestnut St
- 181 Chestnut St
- 1112 Chestnut St
- 1104 Chestnut St
- 169 Grove St
- 166 Chestnut St
- 187 Grove St
- 143 N Elmwood St
- 157 Chestnut St
- 216 Chestnut St
- 248 Chestnut St
- 232 Chestnut St
- 137 Grove St
- 145 Chestnut St
- 201 Grove St
- 197 Grove Rd
- 134 Chestnut St
- 264 Chestnut St