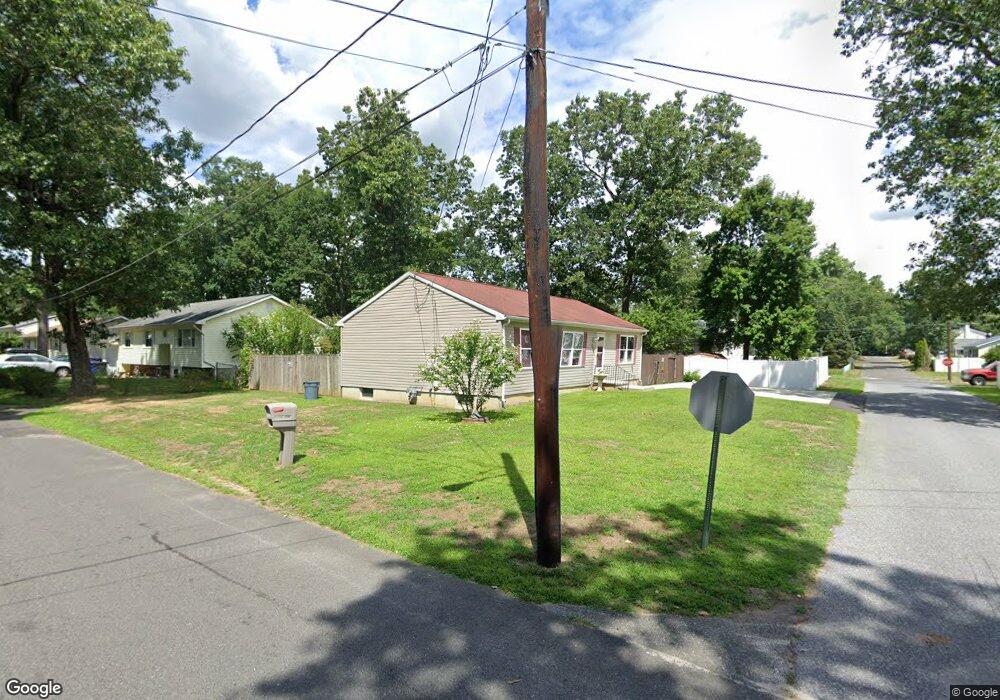
201 Clan St Browns Mills, NJ 08015
Estimated Value: $331,704 - $370,000
--
Bed
--
Bath
1,288
Sq Ft
$274/Sq Ft
Est. Value
About This Home
This home is located at 201 Clan St, Browns Mills, NJ 08015 and is currently estimated at $353,176, approximately $274 per square foot. 201 Clan St is a home located in Burlington County.
Ownership History
Date
Name
Owned For
Owner Type
Purchase Details
Closed on
Sep 27, 2000
Sold by
Pineland Builders Inc
Bought by
Mcgrillies Michelle D
Current Estimated Value
Home Financials for this Owner
Home Financials are based on the most recent Mortgage that was taken out on this home.
Original Mortgage
$106,850
Outstanding Balance
$38,883
Interest Rate
7.89%
Estimated Equity
$314,293
Purchase Details
Closed on
May 5, 2000
Sold by
Schneider Mark A and Schneider Laura V
Bought by
Pineland Builders Inc
Create a Home Valuation Report for This Property
The Home Valuation Report is an in-depth analysis detailing your home's value as well as a comparison with similar homes in the area
Home Values in the Area
Average Home Value in this Area
Purchase History
| Date | Buyer | Sale Price | Title Company |
|---|---|---|---|
| Mcgrillies Michelle D | $112,500 | -- | |
| Pineland Builders Inc | -- | -- | |
| Pineland Builders Inc | -- | -- |
Source: Public Records
Mortgage History
| Date | Status | Borrower | Loan Amount |
|---|---|---|---|
| Open | Mcgrillies Michelle D | $106,850 |
Source: Public Records
Tax History Compared to Growth
Tax History
| Year | Tax Paid | Tax Assessment Tax Assessment Total Assessment is a certain percentage of the fair market value that is determined by local assessors to be the total taxable value of land and additions on the property. | Land | Improvement |
|---|---|---|---|---|
| 2025 | $5,931 | $193,500 | $38,000 | $155,500 |
| 2024 | $5,565 | $193,500 | $38,000 | $155,500 |
| 2023 | $5,565 | $193,500 | $38,000 | $155,500 |
| 2022 | $5,151 | $193,500 | $38,000 | $155,500 |
| 2021 | $4,940 | $193,500 | $38,000 | $155,500 |
| 2020 | $4,754 | $193,500 | $38,000 | $155,500 |
| 2019 | $4,553 | $193,500 | $38,000 | $155,500 |
| 2018 | $4,398 | $193,500 | $38,000 | $155,500 |
| 2017 | $4,307 | $193,500 | $38,000 | $155,500 |
| 2016 | $4,056 | $108,500 | $19,600 | $88,900 |
| 2015 | $4,023 | $108,500 | $19,600 | $88,900 |
| 2014 | $3,846 | $108,500 | $19,600 | $88,900 |
Source: Public Records
Map
Nearby Homes