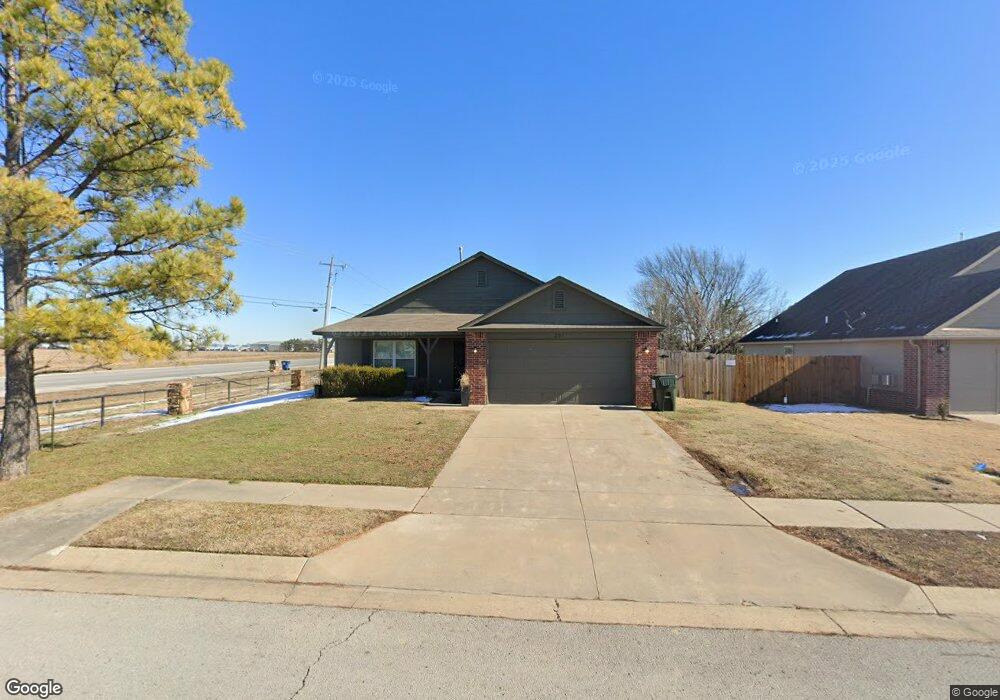
201 Dp Newman Cir Kiefer, OK 74041
Estimated Value: $236,279 - $251,000
--
Bed
--
Bath
1,514
Sq Ft
$160/Sq Ft
Est. Value
About This Home
This home is located at 201 Dp Newman Cir, Kiefer, OK 74041 and is currently estimated at $242,570, approximately $160 per square foot. 201 Dp Newman Cir is a home located in Creek County with nearby schools including Kiefer Elementary School, Rongey Middle School, and Kiefer High School.
Ownership History
Date
Name
Owned For
Owner Type
Purchase Details
Closed on
Aug 30, 2013
Sold by
Bank Of America N A
Bought by
Rose Ii Curtis Lee
Current Estimated Value
Home Financials for this Owner
Home Financials are based on the most recent Mortgage that was taken out on this home.
Original Mortgage
$105,102
Interest Rate
4.56%
Mortgage Type
New Conventional
Purchase Details
Closed on
Jul 1, 2013
Sold by
Rabior Todd L and Garris Melissa K
Bought by
Bank Of America Na
Home Financials for this Owner
Home Financials are based on the most recent Mortgage that was taken out on this home.
Original Mortgage
$105,102
Interest Rate
4.56%
Mortgage Type
New Conventional
Purchase Details
Closed on
Nov 16, 2009
Sold by
Pmc Corp
Bought by
Rabior Todd L and Garris Melissa K
Home Financials for this Owner
Home Financials are based on the most recent Mortgage that was taken out on this home.
Original Mortgage
$124,838
Interest Rate
4.83%
Mortgage Type
New Conventional
Create a Home Valuation Report for This Property
The Home Valuation Report is an in-depth analysis detailing your home's value as well as a comparison with similar homes in the area
Home Values in the Area
Average Home Value in this Area
Purchase History
| Date | Buyer | Sale Price | Title Company |
|---|---|---|---|
| Rose Ii Curtis Lee | $97,500 | None Available | |
| Bank Of America Na | -- | None Available | |
| Rabior Todd L | $122,500 | -- |
Source: Public Records
Mortgage History
| Date | Status | Borrower | Loan Amount |
|---|---|---|---|
| Previous Owner | Rose Ii Curtis Lee | $105,102 | |
| Previous Owner | Rabior Todd L | $124,838 |
Source: Public Records
Tax History Compared to Growth
Tax History
| Year | Tax Paid | Tax Assessment Tax Assessment Total Assessment is a certain percentage of the fair market value that is determined by local assessors to be the total taxable value of land and additions on the property. | Land | Improvement |
|---|---|---|---|---|
| 2025 | $2,062 | $20,157 | $2,868 | $17,289 |
| 2024 | $1,996 | $19,197 | $2,868 | $16,329 |
| 2023 | $1,996 | $18,283 | $2,868 | $15,415 |
| 2022 | $1,746 | $17,413 | $2,868 | $14,545 |
| 2021 | $1,784 | $16,584 | $2,868 | $13,716 |
| 2020 | $1,660 | $15,850 | $2,868 | $12,982 |
| 2019 | $1,719 | $16,663 | $2,868 | $13,795 |
| 2018 | $1,636 | $15,902 | $2,868 | $13,034 |
| 2017 | $1,580 | $15,902 | $2,868 | $13,034 |
| 2016 | $1,591 | $15,902 | $2,868 | $13,034 |
| 2015 | -- | $15,902 | $2,868 | $13,034 |
| 2014 | -- | $15,435 | $2,787 | $12,648 |
Source: Public Records
Map
Nearby Homes
- 129 Dp Newman Cir
- 134 Dp Newman Cir
- 205 Vail Cir
- 205 Taos Dr
- 803 W 150th St
- 15375 S 26th West Ave
- 112 Stark St
- 33 Mary
- 571 W 149th Place
- 311 E Indiana
- 8 Ryan Place
- 467 W 147th Place S
- 14603 S Xenophon Ave
- 341 N Main St
- 15715 S Broadway St
- 110 E 156th Place S
- 41 E 148th St
- 14336 S Barber St
- 13708 S Elwood Ave
- 14812 S Fern Place
- 201 D P Newman Cir
- 203 Dp Newman Cir
- 203 D P Newman Cir
- 205 Dp Newman Cir
- 205 D P Newman Cir
- 202 Dp Newman Cir
- 3978 W 151st St S
- 204 Dp Newman Cir
- 204 D P Newman Cir
- 207 Dp Newman Cir
- 206 Dp Newman Cir
- 206 D P Newman Cir
- 208 Dp Newman Cir
- 209 Dp Newman Cir
- 208 D P Newman Cir
- 209 D P Newman Cir
- 110 Dp Newman Cir
- 101 D P Newman Cir
- 103 D P Newman Cir
- 7 Redbud St