Estimated Value: $300,000 - $421,000
3
Beds
2
Baths
1,750
Sq Ft
$208/Sq Ft
Est. Value
About This Home
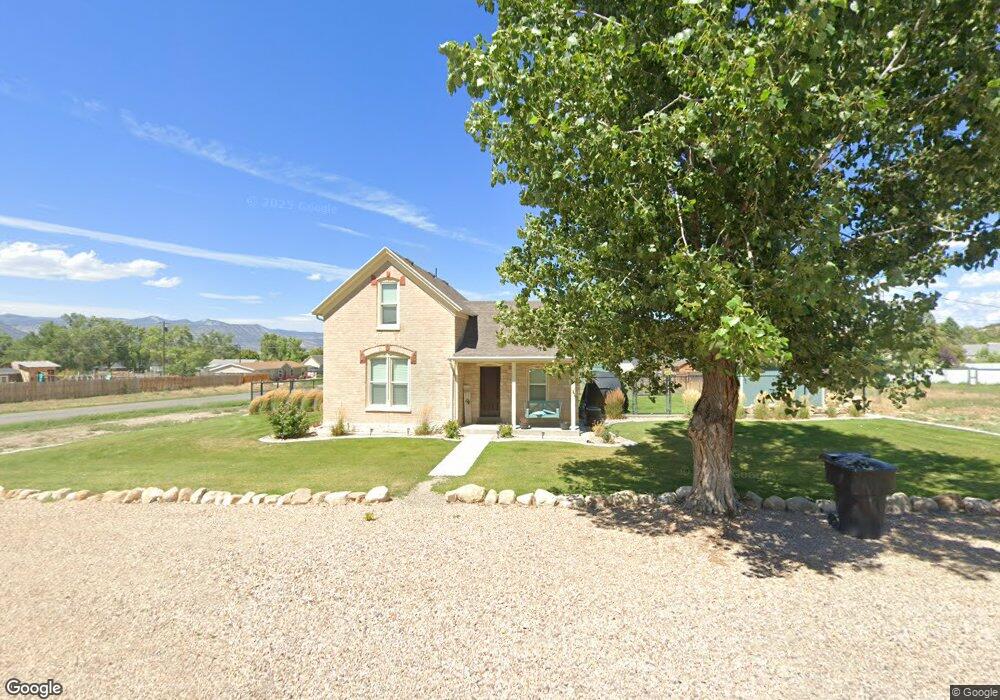
This home is located at 201 E 100 N, Manti, UT 84642 and is currently estimated at $363,150, approximately $207 per square foot. 201 E 100 N is a home located in Sanpete County.
Ownership History
Date
Name
Owned For
Owner Type
Purchase Details
Closed on
Feb 20, 2020
Sold by
Elizabeth Simmons
Bought by
Davison Tamazine J
Current Estimated Value
Home Financials for this Owner
Home Financials are based on the most recent Mortgage that was taken out on this home.
Original Mortgage
$161,750
Outstanding Balance
$143,218
Interest Rate
3.6%
Mortgage Type
Construction
Estimated Equity
$219,932
Purchase Details
Closed on
Nov 15, 2016
Sold by
Dennis Michael N and Dennis Amy S
Bought by
Simmons Elizabeth S
Home Financials for this Owner
Home Financials are based on the most recent Mortgage that was taken out on this home.
Original Mortgage
$125,252
Interest Rate
4.6%
Mortgage Type
New Conventional
Create a Home Valuation Report for This Property
The Home Valuation Report is an in-depth analysis detailing your home's value as well as a comparison with similar homes in the area
Home Values in the Area
Average Home Value in this Area
Purchase History
| Date | Buyer | Sale Price | Title Company |
|---|---|---|---|
| Davison Tamazine J | $202,188 | Central Utah Title | |
| Simmons Elizabeth S | $156,565 | Central Utah Title |
Source: Public Records
Mortgage History
| Date | Status | Borrower | Loan Amount |
|---|---|---|---|
| Open | Davison Tamazine J | $161,750 | |
| Previous Owner | Simmons Elizabeth S | $125,252 | |
| Closed | Simmons Elizabeth S | $125,252 |
Source: Public Records
Tax History Compared to Growth
Tax History
| Year | Tax Paid | Tax Assessment Tax Assessment Total Assessment is a certain percentage of the fair market value that is determined by local assessors to be the total taxable value of land and additions on the property. | Land | Improvement |
|---|---|---|---|---|
| 2024 | $1,433 | $137,685 | $0 | $0 |
| 2023 | $1,426 | $129,282 | $0 | $0 |
| 2022 | $1,406 | $116,176 | $0 | $0 |
| 2021 | $1,332 | $95,300 | $0 | $0 |
| 2020 | $1,243 | $83,641 | $0 | $0 |
| 2019 | $1,177 | $77,831 | $0 | $0 |
| 2018 | $1,183 | $137,500 | $26,730 | $110,770 |
| 2017 | $1,049 | $70,595 | $0 | $0 |
| 2016 | $624 | $41,966 | $0 | $0 |
| 2015 | $627 | $41,966 | $0 | $0 |
| 2014 | $614 | $41,966 | $0 | $0 |
| 2013 | $823 | $56,561 | $0 | $0 |
Source: Public Records
Map
Nearby Homes