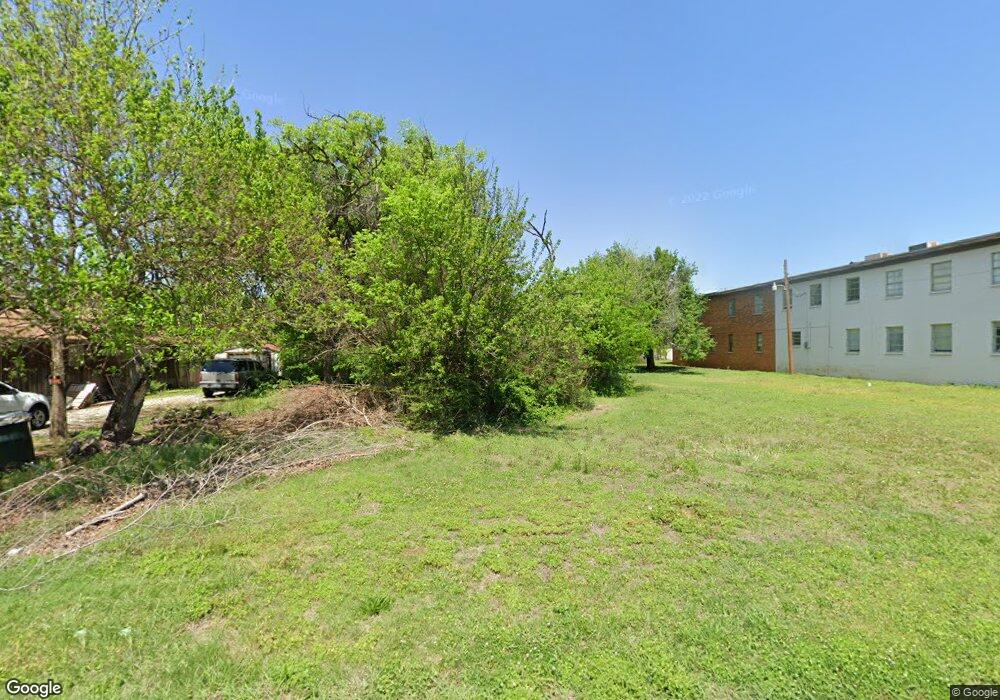
201 E Fig Ave Duncan, OK 73533
Estimated Value: $52,180 - $82,000
2
Beds
1
Bath
996
Sq Ft
$64/Sq Ft
Est. Value
About This Home
This home is located at 201 E Fig Ave, Duncan, OK 73533 and is currently estimated at $63,795, approximately $64 per square foot. 201 E Fig Ave is a home located in Stephens County with nearby schools including Woodrow Wilson Elementary School, Duncan Middle School, and Duncan High School.
Ownership History
Date
Name
Owned For
Owner Type
Purchase Details
Closed on
Apr 8, 2016
Sold by
Smith Kelly Marie
Bought by
Holland Joshua L and Holland Jacinda J
Current Estimated Value
Home Financials for this Owner
Home Financials are based on the most recent Mortgage that was taken out on this home.
Original Mortgage
$47,617
Outstanding Balance
$20,512
Interest Rate
3.62%
Mortgage Type
Commercial
Estimated Equity
$43,283
Purchase Details
Closed on
Apr 7, 2015
Sold by
Holland Joshua and Holland Jacinda
Bought by
Holland Joshua L and Holland Jacinda J
Purchase Details
Closed on
Jun 14, 2005
Sold by
Skiles Jerry Daniel and Skiles Donna Lynn
Bought by
Holland Joshua and Holland Jacinda
Purchase Details
Closed on
May 24, 1994
Sold by
Pace Co
Create a Home Valuation Report for This Property
The Home Valuation Report is an in-depth analysis detailing your home's value as well as a comparison with similar homes in the area
Purchase History
| Date | Buyer | Sale Price | Title Company |
|---|---|---|---|
| Holland Joshua L | $47,500 | None Available | |
| Holland Joshua L | -- | None Available | |
| Holland Joshua | $24,233 | None Available | |
| -- | $7,500 | -- |
Source: Public Records
Mortgage History
| Date | Status | Borrower | Loan Amount |
|---|---|---|---|
| Open | Holland Joshua L | $47,617 |
Source: Public Records
Tax History
| Year | Tax Paid | Tax Assessment Tax Assessment Total Assessment is a certain percentage of the fair market value that is determined by local assessors to be the total taxable value of land and additions on the property. | Land | Improvement |
|---|---|---|---|---|
| 2025 | $286 | $3,392 | $469 | $2,923 |
| 2024 | $262 | $3,077 | $469 | $2,608 |
| 2023 | $262 | $3,077 | $469 | $2,608 |
| 2022 | $237 | $2,835 | $469 | $2,366 |
| 2021 | $237 | $2,791 | $469 | $2,322 |
| 2020 | $219 | $2,532 | $469 | $2,063 |
| 2019 | $263 | $3,038 | $469 | $2,569 |
| 2018 | $258 | $3,038 | $469 | $2,569 |
| 2017 | $237 | $2,756 | $469 | $2,287 |
| 2016 | $259 | $3,048 | $469 | $2,579 |
| 2015 | $220 | $2,910 | $469 | $2,441 |
| 2014 | $220 | $2,772 | $469 | $2,303 |
Source: Public Records
Map
Nearby Homes
- 106 E Fig Ave
- 203 E Fig Ave
- 111 E Fig Ave
- 202 E Hackberry Ave
- 204 E Hackberry Ave
- 120 E Hackberry Ave
- 107 E Fig Ave
- 206 E Hackberry Ave
- 118 E Hackberry Ave
- 202 E Fig Ave
- 110 E Fig Ave
- 204 E Fig Ave
- 208 E Hackberry Ave
- 116 E Hackberry Ave
- 108 E Fig Ave
- 105 E Fig Ave
- 210 E Hackberry Ave
- 111 E Spruce Ave
- 203 E Hackberry Ave
- 212 E Hackberry Ave
Your Personal Tour Guide
Ask me questions while you tour the home.