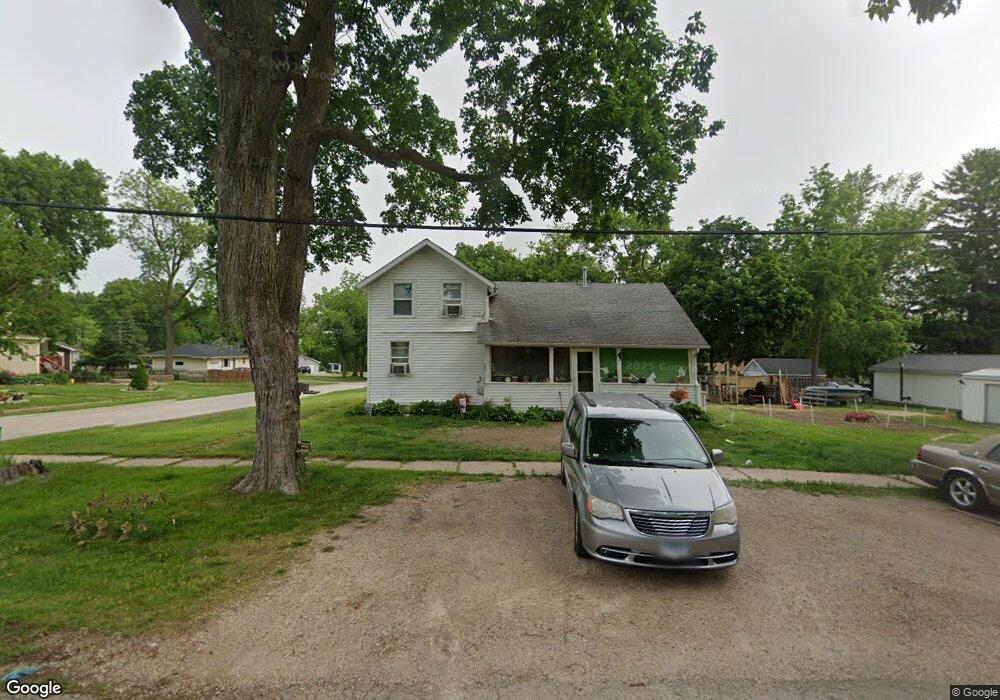
201 E Front St Newark, IL 60541
Estimated Value: $188,000 - $237,703
2
Beds
2
Baths
1,368
Sq Ft
$152/Sq Ft
Est. Value
About This Home
This home is located at 201 E Front St, Newark, IL 60541 and is currently estimated at $207,926, approximately $151 per square foot. 201 E Front St is a home located in Kendall County with nearby schools including Newark Elementary School, Millbrook Junior High School, and Newark Community High School.
Ownership History
Date
Name
Owned For
Owner Type
Purchase Details
Closed on
Jul 3, 2024
Sold by
Milligan Merlin James and Milligan Anita M
Bought by
Redmond Brian
Current Estimated Value
Home Financials for this Owner
Home Financials are based on the most recent Mortgage that was taken out on this home.
Original Mortgage
$169,696
Outstanding Balance
$167,673
Interest Rate
7%
Mortgage Type
New Conventional
Estimated Equity
$40,253
Purchase Details
Closed on
Jan 23, 2006
Sold by
Olson Lance E and Eichhorn Lisa E
Bought by
Milligan Merlin James and Milligan Anita M
Purchase Details
Closed on
Jun 12, 2005
Sold by
Olson Barbara G and Olson Lance E
Bought by
Eichhorn Lisa E and Olson Lance E
Purchase Details
Closed on
Oct 29, 1998
Sold by
Rvs Company
Bought by
Sleezer Robert and Sleezer Kristine K
Create a Home Valuation Report for This Property
The Home Valuation Report is an in-depth analysis detailing your home's value as well as a comparison with similar homes in the area
Home Values in the Area
Average Home Value in this Area
Purchase History
| Date | Buyer | Sale Price | Title Company |
|---|---|---|---|
| Redmond Brian | $168,000 | Wheatland Title | |
| Milligan Merlin James | $65,000 | None Available | |
| Eichhorn Lisa E | -- | -- | |
| Sleezer Robert | -- | -- |
Source: Public Records
Mortgage History
| Date | Status | Borrower | Loan Amount |
|---|---|---|---|
| Open | Redmond Brian | $169,696 |
Source: Public Records
Tax History
| Year | Tax Paid | Tax Assessment Tax Assessment Total Assessment is a certain percentage of the fair market value that is determined by local assessors to be the total taxable value of land and additions on the property. | Land | Improvement |
|---|---|---|---|---|
| 2024 | $3,334 | $44,244 | $18,435 | $25,809 |
| 2023 | $2,741 | $39,730 | $16,554 | $23,176 |
| 2022 | $2,741 | $35,290 | $16,542 | $18,748 |
| 2021 | $2,675 | $33,152 | $15,540 | $17,612 |
| 2020 | $2,610 | $32,576 | $15,270 | $17,306 |
| 2019 | $2,663 | $32,576 | $15,270 | $17,306 |
| 2018 | $2,531 | $30,716 | $15,201 | $15,515 |
| 2017 | $2,526 | $30,310 | $15,000 | $15,310 |
| 2016 | $2,489 | $29,709 | $15,168 | $14,541 |
| 2015 | $2,273 | $29,380 | $15,000 | $14,380 |
| 2014 | -- | $28,997 | $15,044 | $13,953 |
| 2013 | -- | $28,997 | $15,044 | $13,953 |
Source: Public Records
Map
Nearby Homes
- 2 N Van Buren St
- 502 E Benton St
- 11071 Crimmin Rd
- 10978 Crimmin Rd
- 115 Belle Rive Dr
- 2833 N 4201st Rd
- 000 W County Line Rd
- 003 N 4201st Rd
- 001 N 4201st Rd
- 004 N 4201st Rd
- 4322 E 2859th Rd
- 2853 N 4360th Rd
- 16011 Indian Rd
- 2989 N 4459th Rd
- 4452 E 2969th Rd
- 4456 E 2969th Rd
- 4455 E 2969th Rd
- 4460 N 4459th Rd
- 4462 E 2979th Rd
- 3837 E 30th Rd
- 106 N Van Buren St
- 205 E Front St
- 107 E Front St
- 107 Front St
- 105 N Union St
- 206 E Front St
- 107 N Van Buren St
- 208 E Front St
- 108 E Front St
- 103 E Front St
- 104 Chicago Rd
- 202 Chicago Rd
- 109 N Union St
- 106 E Front St
- 301 E Front St
- 203 E Main St
- 302 E Front St
- 108 N Union St
- 104 N Jackson St
- 305 E Main St
Your Personal Tour Guide
Ask me questions while you tour the home.