201 E Liveoak St Unit RR Coleman, TX 76834
Estimated payment $467/month
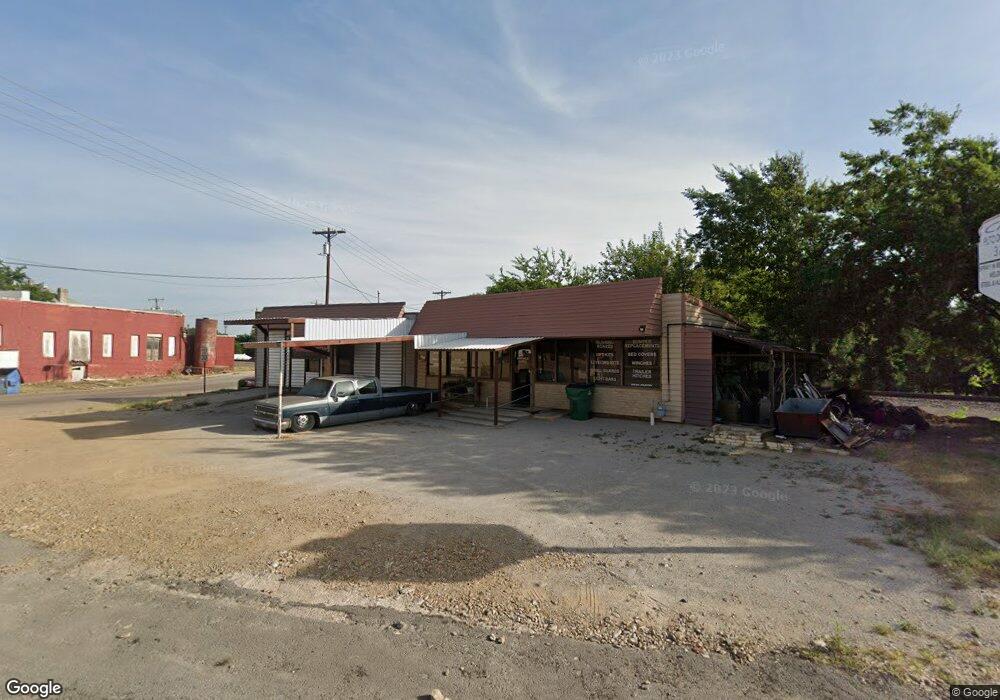
About This Lot
Excellent location in Coleman just one block off Commercial Avenue! Situated on a corner lot with access on both the west & south sides. Has been used a detail shop that also does window tinting. A small office + lobby area in the front with a restroom for customers & a restroom in the back for employees. So much potential in a high traffic area!
All information contained herein is believed to be true & accurate to the best of our knowledge. Liveoak does not make any warranty, either express or implied, as to these statements, but has done our best to verify the above information. Liveoak cooperates fully with other Brokers/Realtors as buyer's representatives. However, buyer's Agents/Brokers must be present from the initial showing forward, or other arrangements made directly with the Listing Agent, to participate in compensation. If buyer's Agents/Brokers are not present from the initial showing forward, compensation will be at the full discretion of Liveoak and may be determined on a case by case basis.

Property Details
Property Type
- Land
Lot Details
- Current uses include commercial
- Potential uses include for development
Map
Home Values in the Area
Average Home Value in this Area
Tax History
| Year | Tax Paid | Tax Assessment Tax Assessment Total Assessment is a certain percentage of the fair market value that is determined by local assessors to be the total taxable value of land and additions on the property. | Land | Improvement |
|---|---|---|---|---|
| 2024 | $1,249 | $53,510 | $12,880 | $40,630 |
| 2023 | $578 | $23,610 | $600 | $23,010 |
| 2022 | $652 | $23,610 | $600 | $23,010 |
| 2021 | $678 | $24,650 | $600 | $24,050 |
| 2020 | $672 | $24,650 | $600 | $24,050 |
| 2019 | $689 | $24,650 | $600 | $24,050 |
| 2018 | $718 | $24,310 | $600 | $23,710 |
| 2017 | $692 | $24,310 | $600 | $23,710 |
| 2016 | $693 | $24,310 | $600 | $23,710 |
| 2015 | -- | $25,630 | $600 | $25,030 |
| 2014 | -- | $25,630 | $600 | $25,030 |
Property History
| Date | Event | Price | List to Sale | Price per Sq Ft |
|---|---|---|---|---|
| 12/10/2025 12/10/25 | For Sale | $69,000 | -- | $43 / Sq Ft |
- 241 East St
- 516 E Live Oak St
- 400 E Walnut St
- 608 E College Ave
- 505 E Walnut St
- 504 S Concho St
- TBD Brazos St
- Cr 411
- 0 Other Unit 127920
- 705 S Concho St
- 810 E Mesquite St
- 315 W Cedar St
- 710 E Mesquite St
- 605 W Walnut St
- 702 W Walnut St
- 908 S Colorado St
- 212 E 2nd St
- 711 & 713 S Neches St
- 911 S Commercial Ave
- 1007 Hwy 84 Bypass