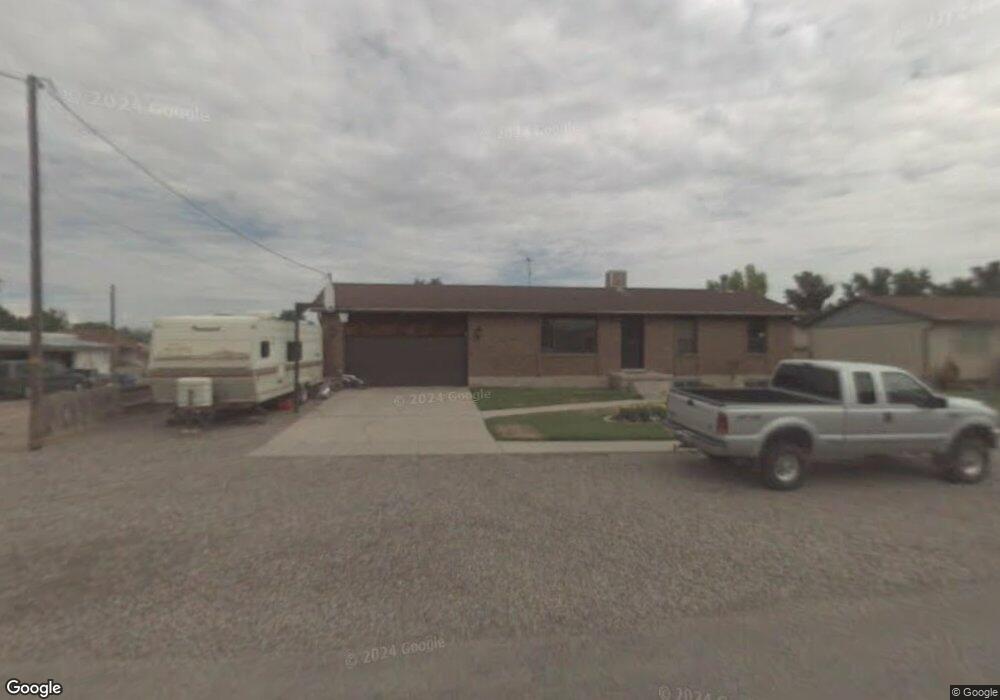
201 E Main St Redmond, UT 84652
Estimated Value: $299,000 - $379,463
5
Beds
3
Baths
2,688
Sq Ft
$125/Sq Ft
Est. Value
About This Home
This home is located at 201 E Main St, Redmond, UT 84652 and is currently estimated at $337,154, approximately $125 per square foot. 201 E Main St is a home located in Sevier County with nearby schools including Salina School, North Sevier Middle School, and North Sevier High School.
Ownership History
Date
Name
Owned For
Owner Type
Purchase Details
Closed on
May 24, 2011
Sold by
Martindale Cory and Martindale Shanda
Bought by
Merchant Rodney Bret and Merchant Keri Jo
Current Estimated Value
Home Financials for this Owner
Home Financials are based on the most recent Mortgage that was taken out on this home.
Original Mortgage
$145,222
Outstanding Balance
$97,416
Interest Rate
4.37%
Mortgage Type
FHA
Estimated Equity
$239,738
Purchase Details
Closed on
Mar 12, 2009
Sold by
Martindale Cody
Bought by
Martindale Cory and Martindale Shanda
Purchase Details
Closed on
Mar 11, 2009
Sold by
Jensen Travis Paul and Jensen Amanda
Bought by
Maritndale Cory
Create a Home Valuation Report for This Property
The Home Valuation Report is an in-depth analysis detailing your home's value as well as a comparison with similar homes in the area
Purchase History
| Date | Buyer | Sale Price | Title Company |
|---|---|---|---|
| Merchant Rodney Bret | -- | -- | |
| Martindale Cory | -- | United Title Services | |
| Maritndale Cory | -- | United Title Services |
Source: Public Records
Mortgage History
| Date | Status | Borrower | Loan Amount |
|---|---|---|---|
| Open | Merchant Rodney Bret | $145,222 |
Source: Public Records
Tax History
| Year | Tax Paid | Tax Assessment Tax Assessment Total Assessment is a certain percentage of the fair market value that is determined by local assessors to be the total taxable value of land and additions on the property. | Land | Improvement |
|---|---|---|---|---|
| 2025 | $1,524 | $180,168 | $27,541 | $152,627 |
| 2024 | $1,524 | $180,952 | $24,227 | $156,725 |
| 2023 | $1,563 | $189,399 | $24,353 | $165,046 |
| 2022 | $1,809 | $182,907 | $25,050 | $157,857 |
| 2021 | $1,526 | $127,588 | $14,300 | $113,288 |
| 2020 | $1,324 | $103,783 | $14,300 | $89,483 |
| 2019 | $1,219 | $102,000 | $14,300 | $87,700 |
| 2018 | $1,152 | $85,420 | $12,870 | $72,550 |
| 2017 | $1,136 | $80,430 | $12,870 | $67,560 |
| 2016 | $924 | $74,880 | $0 | $0 |
| 2015 | $924 | $74,880 | $0 | $0 |
| 2014 | $924 | $74,880 | $0 | $0 |
Source: Public Records
Map
Nearby Homes
Your Personal Tour Guide
Ask me questions while you tour the home.