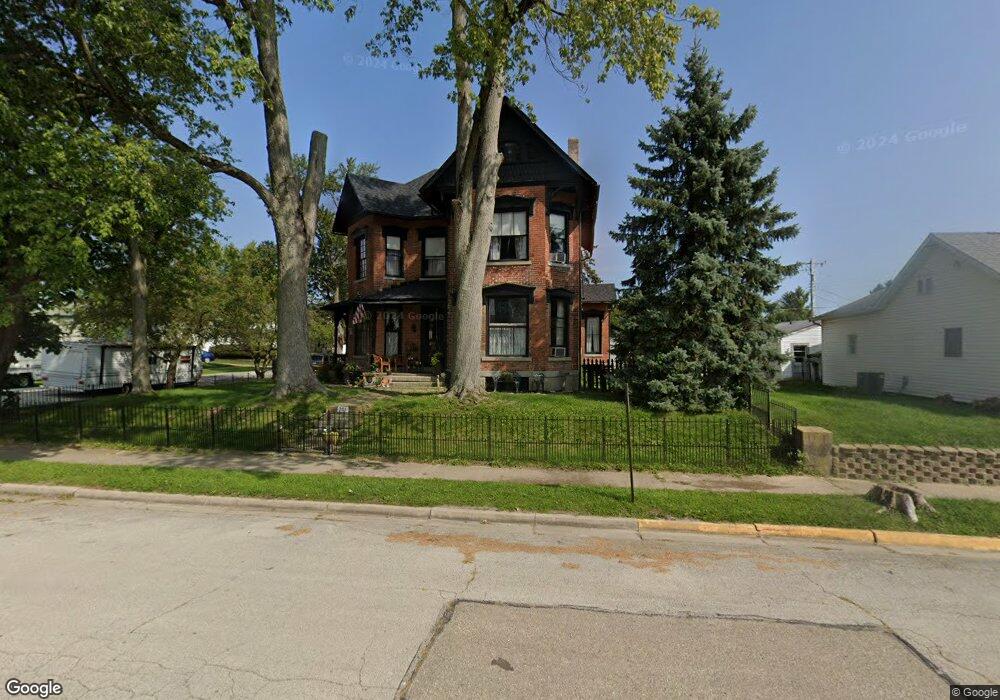
201 E Scott St West Manchester, OH 45382
Estimated Value: $148,000 - $198,000
3
Beds
2
Baths
2,351
Sq Ft
$74/Sq Ft
Est. Value
About This Home
This home is located at 201 E Scott St, West Manchester, OH 45382 and is currently estimated at $174,572, approximately $74 per square foot. 201 E Scott St is a home with nearby schools including National Trail Elementary School, National Trail Middle School, and National Trail High School.
Ownership History
Date
Name
Owned For
Owner Type
Purchase Details
Closed on
Feb 23, 2007
Sold by
Aikman Kenneth Paul and Aikman Julie W
Bought by
Aikman Kenneth Paul and Aikman Julie W
Current Estimated Value
Home Financials for this Owner
Home Financials are based on the most recent Mortgage that was taken out on this home.
Original Mortgage
$104,400
Outstanding Balance
$61,353
Interest Rate
6.28%
Mortgage Type
New Conventional
Estimated Equity
$113,219
Purchase Details
Closed on
Mar 19, 1997
Sold by
Mcclurg Albert J
Bought by
Aikman Kenneth P and Aikman Julie W
Home Financials for this Owner
Home Financials are based on the most recent Mortgage that was taken out on this home.
Original Mortgage
$52,325
Interest Rate
11.41%
Mortgage Type
New Conventional
Purchase Details
Closed on
Apr 17, 1992
Bought by
Aikman Kenneth Paul and Aikman Julie W
Create a Home Valuation Report for This Property
The Home Valuation Report is an in-depth analysis detailing your home's value as well as a comparison with similar homes in the area
Purchase History
| Date | Buyer | Sale Price | Title Company |
|---|---|---|---|
| Aikman Kenneth Paul | -- | Zachs Title Agency | |
| Aikman Kenneth P | $80,500 | -- | |
| Aikman Kenneth Paul | $59,900 | -- |
Source: Public Records
Mortgage History
| Date | Status | Borrower | Loan Amount |
|---|---|---|---|
| Open | Aikman Kenneth Paul | $104,400 | |
| Closed | Aikman Kenneth P | $52,325 |
Source: Public Records
Tax History
| Year | Tax Paid | Tax Assessment Tax Assessment Total Assessment is a certain percentage of the fair market value that is determined by local assessors to be the total taxable value of land and additions on the property. | Land | Improvement |
|---|---|---|---|---|
| 2025 | $1,866 | $48,440 | $5,180 | $43,260 |
| 2024 | $1,866 | $48,440 | $5,180 | $43,260 |
| 2023 | $1,889 | $48,440 | $5,180 | $43,260 |
| 2022 | $1,609 | $35,320 | $3,850 | $31,470 |
| 2021 | $1,685 | $35,320 | $3,850 | $31,470 |
| 2020 | $1,501 | $35,320 | $3,850 | $31,470 |
| 2019 | $1,335 | $31,790 | $3,470 | $28,320 |
| 2018 | $1,315 | $31,790 | $3,470 | $28,320 |
| 2017 | $1,235 | $31,790 | $3,470 | $28,320 |
| 2016 | $1,114 | $28,950 | $3,470 | $25,480 |
| 2014 | $1,077 | $28,950 | $3,470 | $25,480 |
| 2013 | $1,148 | $28,945 | $3,465 | $25,480 |
Source: Public Records
Map
Nearby Homes
- 207 W North St
- 408 N Main St
- 1213 W Holtzmuller Rd
- 246 N Main St
- 410 N Main St
- 160 Main Cross St
- 0 Lewisburg Western Rd
- 0 Friday Rd
- 6254 State Route 722
- 4790 Grubbs Rex Rd
- 2294 U S 40
- 0 Ohio 722 Unit 10052561
- 0 Ohio 722 Unit 949232
- 0 Ohio 722 Unit 1042963
- 1485 State Route 503
- 5900 U S 40
- 6614 Otterbein-Ithaca Rd
- 108 Esther Dr
- 101 Northcreek Dr
- 6051 Sonora Rd
- 207 E Scott St
- 110 High St
- 116 High St
- 217 Scott St
- 115 Scott St
- 111 N High St
- 116 High St
- 115 E Scott St
- 212 E Orchard St
- 118 E Orchard St
- 110 E Scott St
- 110 E Scott St
- 216 E Orchard St
- 238 Jefferson St
- 226 Jefferson St
- 218 Jefferson St
- 200 E Jefferson St
- 100 N Main St
- 206 Jefferson St
- 201 Orchard St
Your Personal Tour Guide
Ask me questions while you tour the home.