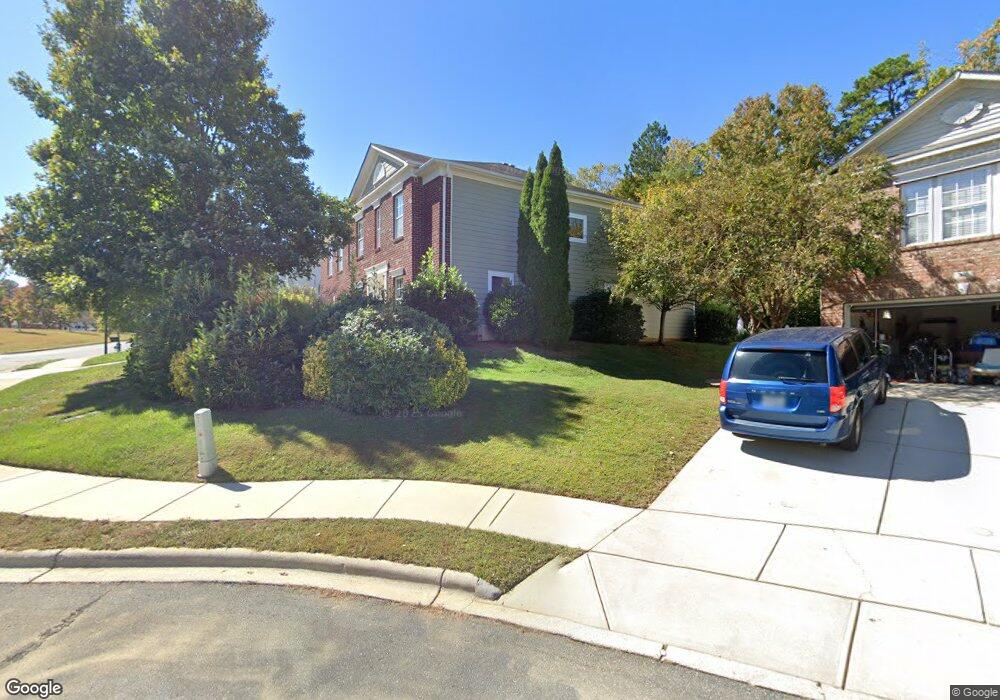
201 Edzell Dr Unit 6 Salisbury, NC 28146
Estimated Value: $385,000 - $455,021
--
Bed
3
Baths
3,735
Sq Ft
$116/Sq Ft
Est. Value
About This Home
This home is located at 201 Edzell Dr Unit 6, Salisbury, NC 28146 and is currently estimated at $433,255, approximately $115 per square foot. 201 Edzell Dr Unit 6 is a home located in Rowan County with nearby schools including E Hanford Dole Elementary School, North Rowan Middle School, and North Rowan High School.
Ownership History
Date
Name
Owned For
Owner Type
Purchase Details
Closed on
Sep 19, 2022
Sold by
Lynn Dixon Mark and Lee Trever
Bought by
Luckey Nia and Luckey Jesse
Current Estimated Value
Home Financials for this Owner
Home Financials are based on the most recent Mortgage that was taken out on this home.
Original Mortgage
$393,680
Outstanding Balance
$376,024
Interest Rate
5.22%
Mortgage Type
VA
Estimated Equity
$57,231
Purchase Details
Closed on
Oct 15, 2008
Sold by
Cp Morgan Communities Of Charlotte Llc
Bought by
Dixon Mark Lynn and Dixon Trever Leigh
Home Financials for this Owner
Home Financials are based on the most recent Mortgage that was taken out on this home.
Original Mortgage
$207,011
Interest Rate
6.34%
Mortgage Type
FHA
Purchase Details
Closed on
Jan 5, 2007
Sold by
Pilot Developers Llc
Bought by
C P Morgan Communities Of Charlotte Llc
Create a Home Valuation Report for This Property
The Home Valuation Report is an in-depth analysis detailing your home's value as well as a comparison with similar homes in the area
Home Values in the Area
Average Home Value in this Area
Purchase History
| Date | Buyer | Sale Price | Title Company |
|---|---|---|---|
| Luckey Nia | $380,000 | -- | |
| Luckey Nia | $380,000 | None Listed On Document | |
| Dixon Mark Lynn | $210,500 | None Available | |
| C P Morgan Communities Of Charlotte Llc | $195,000 | None Available |
Source: Public Records
Mortgage History
| Date | Status | Borrower | Loan Amount |
|---|---|---|---|
| Open | Luckey Nia | $393,680 | |
| Closed | Luckey Nia | $393,680 | |
| Previous Owner | Dixon Mark Lynn | $207,011 |
Source: Public Records
Tax History Compared to Growth
Tax History
| Year | Tax Paid | Tax Assessment Tax Assessment Total Assessment is a certain percentage of the fair market value that is determined by local assessors to be the total taxable value of land and additions on the property. | Land | Improvement |
|---|---|---|---|---|
| 2025 | $4,287 | $358,483 | $32,500 | $325,983 |
| 2024 | $4,287 | $358,483 | $32,500 | $325,983 |
| 2023 | $4,287 | $358,483 | $32,500 | $325,983 |
| 2022 | $3,035 | $220,380 | $25,000 | $195,380 |
| 2021 | $3,035 | $220,380 | $25,000 | $195,380 |
| 2020 | $3,035 | $220,380 | $25,000 | $195,380 |
| 2019 | $3,035 | $220,380 | $25,000 | $195,380 |
| 2018 | $2,659 | $195,713 | $25,000 | $170,713 |
| 2017 | $2,645 | $195,713 | $25,000 | $170,713 |
| 2016 | $2,573 | $195,713 | $25,000 | $170,713 |
| 2015 | $2,588 | $195,713 | $25,000 | $170,713 |
| 2014 | $2,675 | $204,699 | $28,500 | $176,199 |
Source: Public Records
Map
Nearby Homes
- 107 Laura Springs Dr
- 755 Gondola Ct
- 755 Gondola Ct Unit 114
- 204 Shay Crossing Rd
- 330 Shay Crossing Rd Unit 71Ap
- Baxter Plan at Shay Crossing
- Elon Plan at Shay Crossing
- Lido Plan at Shay Crossing
- Knox Plan at Shay Crossing
- Alder Plan at Shay Crossing
- Kane Plan at Shay Crossing
- Abigale Plan at Shay Crossing
- Coronado Plan at Shay Crossing
- 106 Birmingham Place
- 106 Travis Ln
- 129 Ann St
- 1906 E Innes St
- 1904 E Innes St
- 1706 Whitney Ln
- 2560 Jake Alexander Blvd S
- 201 Edzell Dr
- 119 Edzell Dr
- 205 Edzell Dr
- 115 Edzell Dr
- 209 Edzell Dr
- 209 Edzell Dr Unit 8
- 202 Edzell Dr
- 301 Inverness Ln
- 226 S Cleo Ave
- 222 S Cleo Ave
- 224 S Cleo Ave
- 111 Edzell Dr
- 109 Sills Dr
- 113 Sills Dr
- 210 Edzell Dr
- 305 Inverness Ln
- 109 Edzell Dr
- 109 Edzell Dr Unit 2
- 117 Sills Dr
- 2704 Stokes Ferry Rd