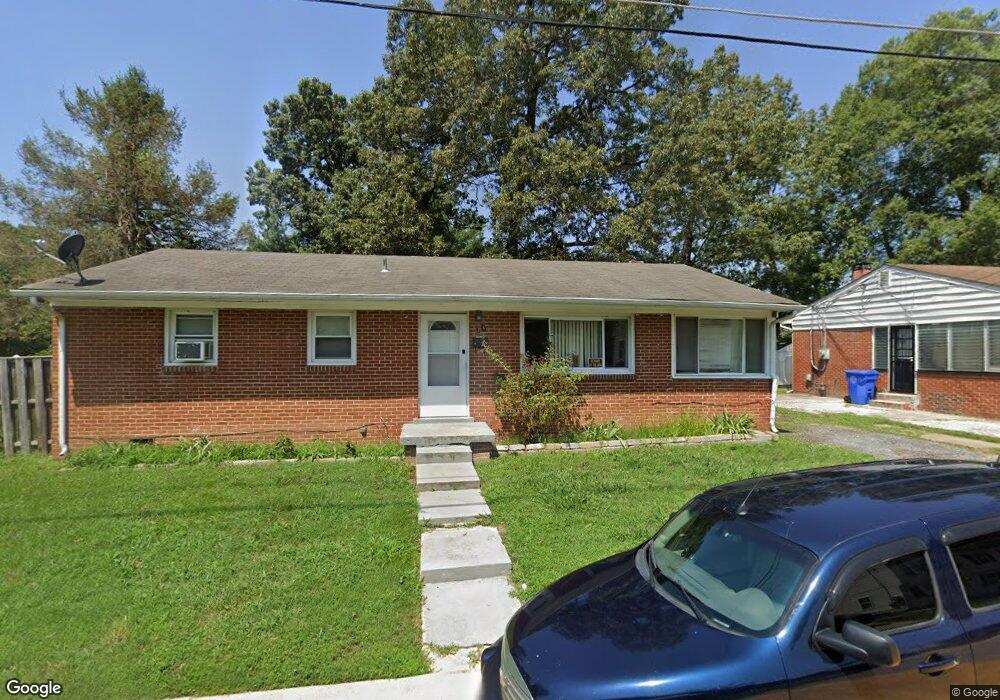
201 Ellerbe Dr Indian Head, MD 20640
Estimated Value: $267,000 - $296,000
--
Bed
1
Bath
988
Sq Ft
$287/Sq Ft
Est. Value
About This Home
This home is located at 201 Ellerbe Dr, Indian Head, MD 20640 and is currently estimated at $283,381, approximately $286 per square foot. 201 Ellerbe Dr is a home located in Charles County with nearby schools including Indian Head Elementary School, General Smallwood Middle School, and Henry E. Lackey High School.
Ownership History
Date
Name
Owned For
Owner Type
Purchase Details
Closed on
Apr 16, 2021
Sold by
Simms Thomas C
Bought by
Fazenbaker Jaimi L
Current Estimated Value
Home Financials for this Owner
Home Financials are based on the most recent Mortgage that was taken out on this home.
Original Mortgage
$237,616
Outstanding Balance
$214,881
Interest Rate
3.1%
Mortgage Type
FHA
Estimated Equity
$68,500
Purchase Details
Closed on
May 8, 2013
Sold by
Department Of Housing And Urban Developm
Bought by
Simms Thomas C
Purchase Details
Closed on
Nov 4, 2010
Sold by
Warren Wilbert B
Bought by
Secretary Of Housing & Urban Development
Purchase Details
Closed on
Apr 23, 2003
Sold by
Wilburn Mark E and Brown Shellie M
Bought by
Warren Wilbert B
Purchase Details
Closed on
May 29, 1996
Sold by
Chase Manhattan Bank Na
Bought by
Wilburn Mark E and Brown Shellie M
Purchase Details
Closed on
Jun 29, 1994
Sold by
Sovoy Kelton Tr Cc
Bought by
Chase Manhattan Bk
Create a Home Valuation Report for This Property
The Home Valuation Report is an in-depth analysis detailing your home's value as well as a comparison with similar homes in the area
Home Values in the Area
Average Home Value in this Area
Purchase History
| Date | Buyer | Sale Price | Title Company |
|---|---|---|---|
| Fazenbaker Jaimi L | $242,000 | Dream Title & Escrow Llc | |
| Simms Thomas C | $79,000 | None Available | |
| Secretary Of Housing & Urban Development | $88,997 | None Available | |
| Warren Wilbert B | $109,900 | -- | |
| Wilburn Mark E | $58,000 | -- | |
| Chase Manhattan Bk | $16,000 | -- |
Source: Public Records
Mortgage History
| Date | Status | Borrower | Loan Amount |
|---|---|---|---|
| Open | Fazenbaker Jaimi L | $237,616 | |
| Closed | Wilburn Mark E | -- |
Source: Public Records
Tax History Compared to Growth
Tax History
| Year | Tax Paid | Tax Assessment Tax Assessment Total Assessment is a certain percentage of the fair market value that is determined by local assessors to be the total taxable value of land and additions on the property. | Land | Improvement |
|---|---|---|---|---|
| 2025 | $7,215 | $217,100 | $70,000 | $147,100 |
| 2024 | $3,192 | $195,467 | $0 | $0 |
| 2023 | $2,786 | $173,833 | $0 | $0 |
| 2022 | $2,423 | $152,200 | $64,000 | $88,200 |
| 2021 | $4,711 | $146,733 | $0 | $0 |
| 2020 | $2,248 | $141,267 | $0 | $0 |
| 2019 | $2,163 | $135,800 | $60,000 | $75,800 |
| 2018 | $1,738 | $132,000 | $0 | $0 |
| 2017 | $2,014 | $128,200 | $0 | $0 |
| 2016 | -- | $124,400 | $0 | $0 |
| 2015 | $1,976 | $124,400 | $0 | $0 |
| 2014 | $1,976 | $124,400 | $0 | $0 |
Source: Public Records
Map
Nearby Homes
- 117 Riverside Run Dr
- 13 Beth Ct
- 9 Beth Ct
- 3 Oakside Ln
- 14 Oakside Ln
- 21 Meadowside Ct
- 1 Meadowside Ct
- lot 1 Travers Rd
- 3 Riverside Run Dr
- 132 Charles Place
- 408 Bland Dr
- 4601 Strauss Ave
- 10 Prospect Ave
- 4350 Strauss Ave
- 401 Indian Head Ave
- 105 Bland Dr
- 41 Dove Tree Ct
- 26 Lookout Dr
- 29 Stuart Place
- 105 Caswell Dr