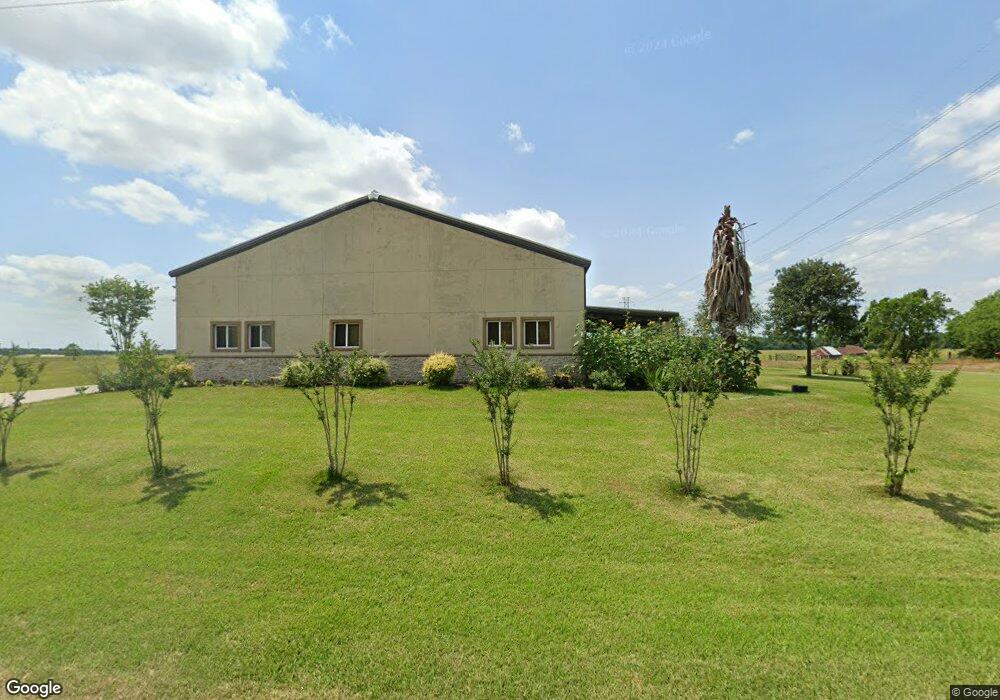
201 Evans Rd Rosenberg, TX 77471
Estimated Value: $556,000 - $759,000
4
Beds
2
Baths
2,940
Sq Ft
$225/Sq Ft
Est. Value
About This Home
This home is located at 201 Evans Rd, Rosenberg, TX 77471 and is currently estimated at $662,139, approximately $225 per square foot. 201 Evans Rd is a home with nearby schools including Bentley Elementary School, Briscoe Junior High School, and Foster High School.
Ownership History
Date
Name
Owned For
Owner Type
Purchase Details
Closed on
Dec 30, 2013
Sold by
Schramime Wayne
Bought by
Birdwell Annette C
Current Estimated Value
Home Financials for this Owner
Home Financials are based on the most recent Mortgage that was taken out on this home.
Original Mortgage
$35,660
Outstanding Balance
$26,890
Interest Rate
4.36%
Mortgage Type
Purchase Money Mortgage
Estimated Equity
$635,249
Purchase Details
Closed on
Dec 21, 2009
Sold by
Schramme Wayne Allen
Bought by
Schramme Family Partnership Ltd
Purchase Details
Closed on
Nov 19, 2007
Sold by
Parr Family Lp
Bought by
Schramme Wayne
Home Financials for this Owner
Home Financials are based on the most recent Mortgage that was taken out on this home.
Original Mortgage
$310,639
Interest Rate
6.38%
Mortgage Type
Purchase Money Mortgage
Create a Home Valuation Report for This Property
The Home Valuation Report is an in-depth analysis detailing your home's value as well as a comparison with similar homes in the area
Home Values in the Area
Average Home Value in this Area
Purchase History
| Date | Buyer | Sale Price | Title Company |
|---|---|---|---|
| Birdwell Annette C | -- | None Available | |
| Schramme Family Partnership Ltd | -- | None Available | |
| Birdwell Annette C | -- | -- | |
| Schramme Wayne | -- | Startex Title | |
| Birdwell Annette C | -- | -- |
Source: Public Records
Mortgage History
| Date | Status | Borrower | Loan Amount |
|---|---|---|---|
| Open | Birdwell Annette C | $35,660 | |
| Previous Owner | Birdwell Annette C | $310,639 |
Source: Public Records
Tax History
| Year | Tax Paid | Tax Assessment Tax Assessment Total Assessment is a certain percentage of the fair market value that is determined by local assessors to be the total taxable value of land and additions on the property. | Land | Improvement |
|---|---|---|---|---|
| 2025 | $4,023 | $588,328 | $267,678 | $454,079 |
| 2024 | $4,023 | $534,844 | $87,295 | $447,549 |
| 2023 | $4,023 | $486,222 | -- | $548,584 |
| 2022 | $5,991 | $442,020 | $0 | $567,480 |
| 2021 | $8,274 | $398,800 | $35,660 | $363,140 |
| 2020 | $8,619 | $406,100 | $35,660 | $370,440 |
| 2019 | $8,432 | $369,180 | $35,660 | $333,520 |
| 2018 | $9,521 | $410,210 | $35,660 | $374,550 |
| 2017 | $8,804 | $377,180 | $35,660 | $341,520 |
| 2016 | $8,003 | $342,890 | $35,660 | $307,230 |
| 2015 | $6,026 | $333,020 | $35,660 | $297,360 |
| 2014 | $6,031 | $309,530 | $35,660 | $273,870 |
Source: Public Records
Map
Nearby Homes
- 6410 Oxford Lake Dr
- 0 Fm 723 Rd
- 6111 Wickshire Dr
- 6226 Mason Way
- 2019 Preston Park
- 2607 Patricia Crossing
- 6014 Watford Bend
- 5814 Wayne Way
- 6027 Prince Place Dr
- 2027 Wembley Way
- 5922 Watford Bend
- 6014 Prince Place Dr
- 6007 Prince Place Dr
- 1021 Mehrens Rd
- 2419 Humble Way
- 5819 Watford Bend
- 2510 Humble Way
- 5919 Micah Ln
- 2227 Leonetti Ln
- 1101 Baker Rd
- 449 Evans Rd
- 1925 Fm 723 Rd
- 6414 Oxford Lake Dr
- 6410 Oxford Lake Dr
- 0 Farm To Market Road 723
- 6406 Oxford Lake Dr
- 2119 Foxgate Dr
- 6414 Carnaby Ln
- 2115 Foxgate Dr
- 2111 Foxgate Dr
- 6410 Carnaby Ln
- 6410 Carnaby Ln
- 2107 Foxgate Dr
- 6402 Oxford Lake Dr
- 2103 Foxgate Dr
- 2019 Foxgate Dr
- 6415 Carnaby Ln
- 2015 Foxgate Dr
- 6406 Carnaby Ln
- 6330 Oxford Lake Dr
Your Personal Tour Guide
Ask me questions while you tour the home.