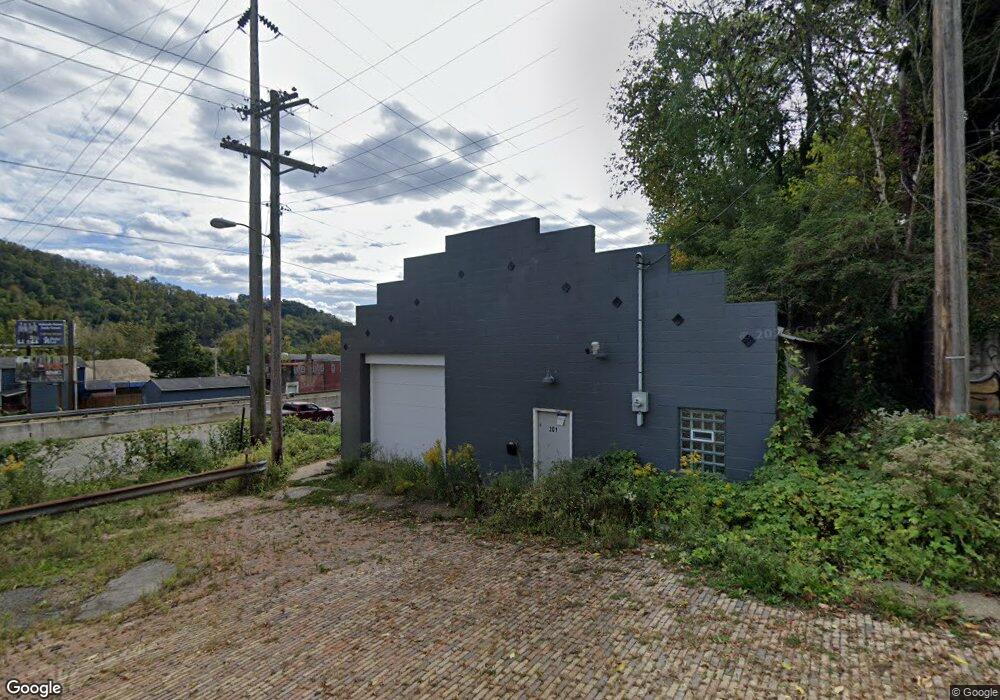
201 Fayette St Martins Ferry, OH 43935
Estimated Value: $81,589
--
Bed
--
Bath
1,592
Sq Ft
$51/Sq Ft
Est. Value
About This Home
This home is located at 201 Fayette St, Martins Ferry, OH 43935 and is currently estimated at $81,589, approximately $51 per square foot. 201 Fayette St is a home located in Belmont County with nearby schools including Anna Marie Ayers Elementary School, Martins Ferry Middle School, and Martins Ferry High School.
Ownership History
Date
Name
Owned For
Owner Type
Purchase Details
Closed on
Sep 25, 2018
Sold by
Jusson Company Llc
Bought by
Marco Partners Lp
Current Estimated Value
Purchase Details
Closed on
Nov 25, 2013
Sold by
Mckenzie Ronald M and Mckenzie Casey A
Bought by
Jusson Company Llc
Purchase Details
Closed on
Apr 29, 2008
Sold by
Estate Of David E Talbert
Bought by
Phillips John and Carlton Mary Jo
Purchase Details
Closed on
Mar 1, 2008
Sold by
Silvenski Daniel and Silvenski Gina
Bought by
Mckenzie Ronald M
Purchase Details
Closed on
Feb 28, 2008
Sold by
Phillips John and Phillips Marian
Bought by
Mckenzie Ronald M
Purchase Details
Closed on
Feb 25, 2008
Sold by
Carlton Jeffrey and Carlton Mary Jo
Bought by
Mckenzie Ronald M
Purchase Details
Closed on
Feb 5, 2008
Sold by
Durbin Jeffrey and Durbin Charlene
Bought by
Mckenzie Ronald M
Purchase Details
Closed on
Jan 1, 1987
Sold by
Talbert David E
Bought by
Talbert David E
Create a Home Valuation Report for This Property
The Home Valuation Report is an in-depth analysis detailing your home's value as well as a comparison with similar homes in the area
Home Values in the Area
Average Home Value in this Area
Purchase History
| Date | Buyer | Sale Price | Title Company |
|---|---|---|---|
| Marco Partners Lp | $59,000 | None Available | |
| Jusson Company Llc | $18,666 | Attorney | |
| Phillips John | -- | None Available | |
| Mckenzie Ronald M | -- | Attorney | |
| Mckenzie Ronald M | -- | Attorney | |
| Mckenzie Ronald M | -- | Attorney | |
| Mckenzie Ronald M | -- | Attorney | |
| Talbert David E | -- | -- |
Source: Public Records
Tax History Compared to Growth
Tax History
| Year | Tax Paid | Tax Assessment Tax Assessment Total Assessment is a certain percentage of the fair market value that is determined by local assessors to be the total taxable value of land and additions on the property. | Land | Improvement |
|---|---|---|---|---|
| 2024 | $461 | $8,510 | $4,300 | $4,210 |
| 2023 | $117 | $1,850 | $1,160 | $690 |
| 2022 | $116 | $1,848 | $1,155 | $693 |
| 2021 | $119 | $1,848 | $1,155 | $693 |
| 2020 | $121 | $1,850 | $1,160 | $690 |
| 2019 | $123 | $1,850 | $1,160 | $690 |
| 2018 | $125 | $1,850 | $1,160 | $690 |
| 2017 | $157 | $2,480 | $1,120 | $1,360 |
| 2016 | $160 | $2,480 | $1,120 | $1,360 |
| 2015 | $149 | $2,480 | $1,120 | $1,360 |
| 2014 | $147 | $2,320 | $1,050 | $1,270 |
| 2013 | $130 | $2,320 | $1,050 | $1,270 |
Source: Public Records
Map
Nearby Homes