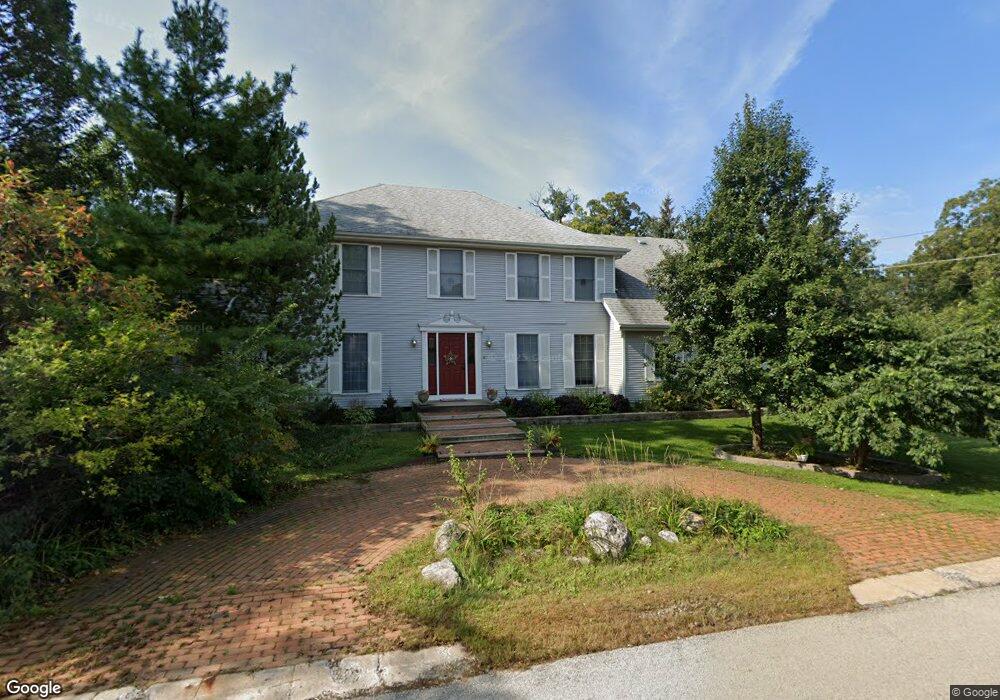
201 Forest Ave Willow Springs, IL 60480
Estimated Value: $458,000 - $602,000
5
Beds
3
Baths
2,350
Sq Ft
$235/Sq Ft
Est. Value
About This Home
This home is located at 201 Forest Ave, Willow Springs, IL 60480 and is currently estimated at $551,224, approximately $234 per square foot. 201 Forest Ave is a home located in Cook County with nearby schools including Willow Springs Elementary School, Argo Community High School, and St. Patricia School.
Ownership History
Date
Name
Owned For
Owner Type
Purchase Details
Closed on
Jun 12, 2019
Sold by
Darrah Ryan Richard
Bought by
Darrah Ryan Richard and Darrah Lynn Marcia
Current Estimated Value
Purchase Details
Closed on
Jun 30, 2011
Sold by
Real Equities Inc
Bought by
Darrah Ryan
Home Financials for this Owner
Home Financials are based on the most recent Mortgage that was taken out on this home.
Original Mortgage
$216,000
Outstanding Balance
$148,952
Interest Rate
4.56%
Mortgage Type
New Conventional
Estimated Equity
$402,272
Purchase Details
Closed on
May 21, 2010
Sold by
Welchko Kristina J
Bought by
Real Equities Inc
Purchase Details
Closed on
Feb 10, 2003
Sold by
Welchko Donald C
Bought by
Welchko Kristina
Purchase Details
Closed on
Sep 18, 2000
Sold by
Welchko Donald C and Welchko Kristina J
Bought by
Welchko Donald C and Welchko Kristina J
Create a Home Valuation Report for This Property
The Home Valuation Report is an in-depth analysis detailing your home's value as well as a comparison with similar homes in the area
Home Values in the Area
Average Home Value in this Area
Purchase History
| Date | Buyer | Sale Price | Title Company |
|---|---|---|---|
| Darrah Ryan Richard | -- | Attorney | |
| Darrah Ryan | $270,000 | Cti | |
| Real Equities Inc | -- | None Available | |
| Welchko Kristina | -- | Chicago Title Insurance Co | |
| Welchko Donald C | -- | Chicago Title Insurance Co |
Source: Public Records
Mortgage History
| Date | Status | Borrower | Loan Amount |
|---|---|---|---|
| Open | Darrah Ryan | $216,000 |
Source: Public Records
Tax History Compared to Growth
Tax History
| Year | Tax Paid | Tax Assessment Tax Assessment Total Assessment is a certain percentage of the fair market value that is determined by local assessors to be the total taxable value of land and additions on the property. | Land | Improvement |
|---|---|---|---|---|
| 2024 | $12,594 | $44,330 | $6,417 | $37,913 |
| 2023 | $16,955 | $44,330 | $6,417 | $37,913 |
| 2022 | $16,955 | $45,276 | $5,580 | $39,696 |
| 2021 | $16,745 | $45,275 | $5,580 | $39,695 |
| 2020 | $18,295 | $50,262 | $5,580 | $44,682 |
| 2019 | $13,074 | $35,628 | $5,022 | $30,606 |
| 2018 | $12,660 | $35,628 | $5,022 | $30,606 |
| 2017 | $13,949 | $38,941 | $5,022 | $33,919 |
| 2016 | $12,424 | $31,258 | $4,464 | $26,794 |
| 2015 | $12,612 | $33,801 | $4,464 | $29,337 |
| 2014 | $14,065 | $38,018 | $4,464 | $33,554 |
| 2013 | $11,157 | $33,687 | $4,464 | $29,223 |
Source: Public Records
Map
Nearby Homes
- 815 Vinewood Ave
- 106 Kazwell St
- 8395 Archer Ave
- 506 S Charleton St
- 8422 Archer Ave
- 8420 Archer Ave
- 8473 Archer Ave Unit 204
- 133 Rachel Ave Unit 501D
- 8601 S Kean Ave
- 5 Cliffside Dr Unit 5
- 8611 Archer Ave
- 8832 Rust St Unit 3
- 8832 Rust St Unit 1
- 8832 Rust St Unit 2
- Douglas Plan at Willow Springs Town Center
- 1048 Testa Dr
- 9141 Meadowview Dr
- 710 Briarwood Dr Unit 710
- 8036 Fawn Trail
- 400 Village Cir Unit 109
- 805 Vinewood Ave
- 807 Vinewood Ave
- 203 Forest Ave
- 206 Forest Ave
- 202 Forest Ave
- 113 Forest Ave
- 809 Vinewood Ave
- 208 Forest Ave
- 806 Cedar St
- 728 Vinewood Ave
- 210 Forest Ave
- 808 Vinewood Ave
- 112 Forest Ave
- 112A Forest Ave
- 810 Cedar St
- 810 Cedar St
- 111 Forest Ave
- 811 Vinewood Ave
- 806 Vinewood Ave
- 722 Cedar St