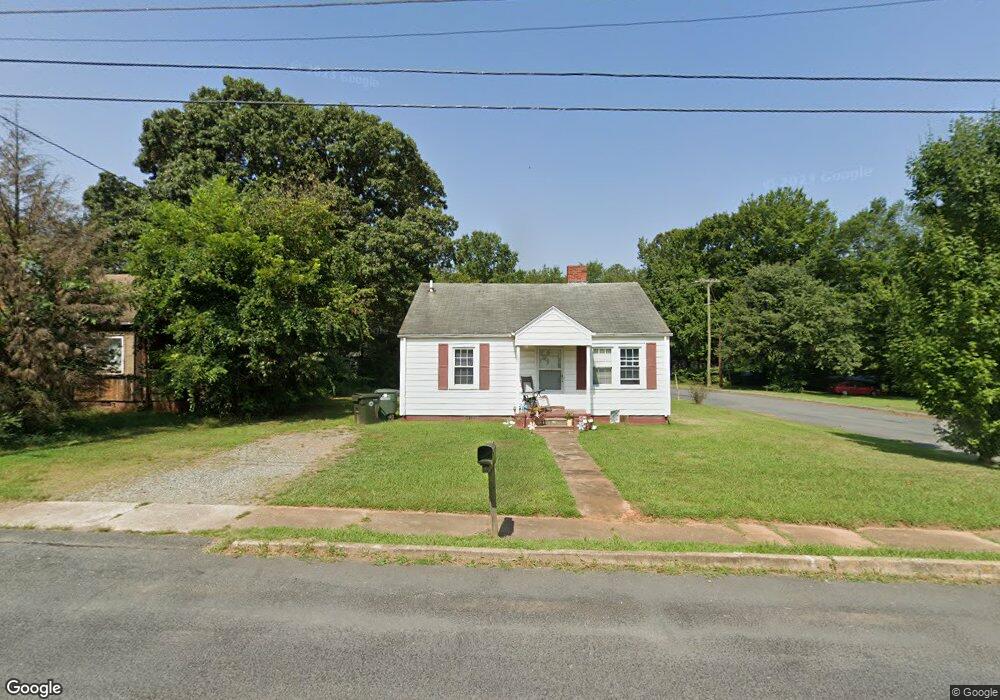
201 Foy Ave Lexington, NC 27292
Estimated Value: $119,000 - $165,000
2
Beds
1
Bath
872
Sq Ft
$154/Sq Ft
Est. Value
About This Home
This home is located at 201 Foy Ave, Lexington, NC 27292 and is currently estimated at $134,667, approximately $154 per square foot. 201 Foy Ave is a home located in Davidson County with nearby schools including South Lexington School, Lexington Middle School, and Lexington Senior High School.
Ownership History
Date
Name
Owned For
Owner Type
Purchase Details
Closed on
Jul 27, 2018
Sold by
Moore James D and Moore Martha H
Bought by
Rb Capital Group Llc
Current Estimated Value
Home Financials for this Owner
Home Financials are based on the most recent Mortgage that was taken out on this home.
Original Mortgage
$261,920
Outstanding Balance
$227,467
Interest Rate
4.5%
Mortgage Type
Purchase Money Mortgage
Estimated Equity
-$92,800
Purchase Details
Closed on
Mar 23, 1982
Create a Home Valuation Report for This Property
The Home Valuation Report is an in-depth analysis detailing your home's value as well as a comparison with similar homes in the area
Home Values in the Area
Average Home Value in this Area
Purchase History
| Date | Buyer | Sale Price | Title Company |
|---|---|---|---|
| Rb Capital Group Llc | $327,500 | None Available | |
| -- | -- | -- |
Source: Public Records
Mortgage History
| Date | Status | Borrower | Loan Amount |
|---|---|---|---|
| Open | Rb Capital Group Llc | $261,920 |
Source: Public Records
Tax History Compared to Growth
Tax History
| Year | Tax Paid | Tax Assessment Tax Assessment Total Assessment is a certain percentage of the fair market value that is determined by local assessors to be the total taxable value of land and additions on the property. | Land | Improvement |
|---|---|---|---|---|
| 2025 | $569 | $43,790 | $0 | $0 |
| 2024 | $569 | $43,790 | $0 | $0 |
| 2023 | $569 | $43,790 | $0 | $0 |
| 2022 | $569 | $43,790 | $0 | $0 |
| 2021 | $569 | $43,790 | $0 | $0 |
| 2020 | $465 | $36,040 | $0 | $0 |
| 2019 | $472 | $36,040 | $0 | $0 |
| 2018 | $472 | $36,040 | $0 | $0 |
| 2017 | $472 | $36,040 | $0 | $0 |
| 2016 | $472 | $36,040 | $0 | $0 |
| 2015 | $454 | $36,040 | $0 | $0 |
| 2014 | $375 | $29,780 | $0 | $0 |
Source: Public Records
Map
Nearby Homes