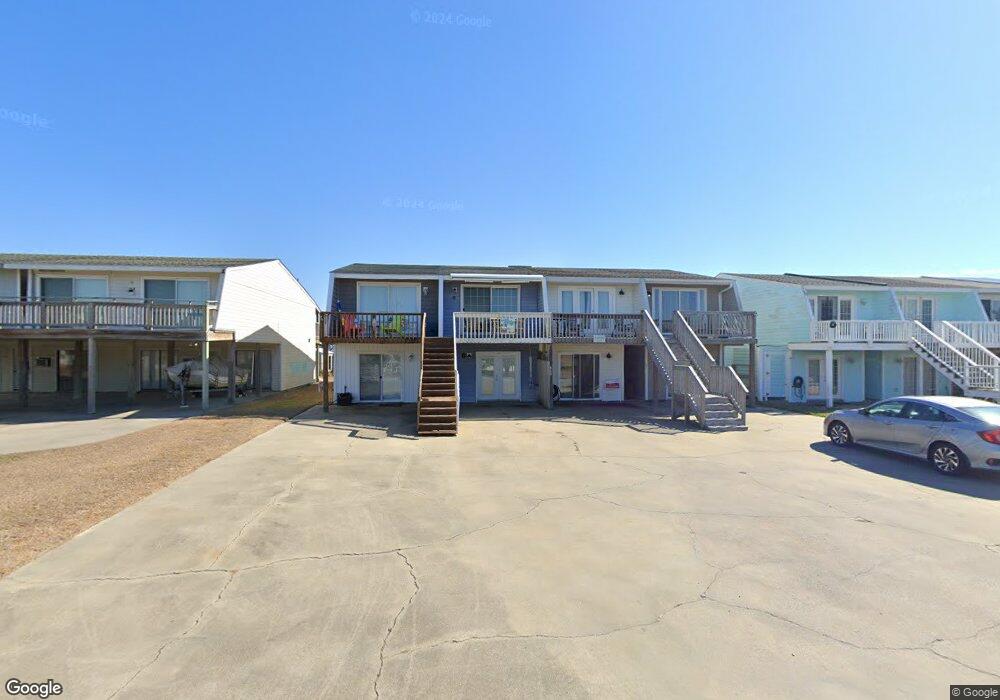
201 Freeman Ln Atlantic Beach, NC 28512
Estimated Value: $364,726 - $495,000
2
Beds
2
Baths
784
Sq Ft
$573/Sq Ft
Est. Value
About This Home
This home is located at 201 Freeman Ln, Atlantic Beach, NC 28512 and is currently estimated at $448,932, approximately $572 per square foot. 201 Freeman Ln is a home located in Carteret County with nearby schools including Morehead City Primary School, Morehead Elementary School at Camp Glenn, and Morehead City Middle School.
Ownership History
Date
Name
Owned For
Owner Type
Purchase Details
Closed on
Feb 27, 2024
Sold by
Parker Hugh Randall and Parker Jessica
Bought by
Johnson Kyle Andrew and Sdao Johnson Anna
Current Estimated Value
Home Financials for this Owner
Home Financials are based on the most recent Mortgage that was taken out on this home.
Original Mortgage
$378,250
Outstanding Balance
$371,923
Interest Rate
6.6%
Mortgage Type
New Conventional
Estimated Equity
$77,009
Purchase Details
Closed on
Oct 5, 2022
Sold by
Nicholas Mark D and Nicholas Eileen G
Bought by
Parker Hugh Randall and Parker Jessica
Home Financials for this Owner
Home Financials are based on the most recent Mortgage that was taken out on this home.
Original Mortgage
$332,000
Interest Rate
5.55%
Mortgage Type
New Conventional
Purchase Details
Closed on
Jul 2, 2019
Sold by
Pully Jackie S
Bought by
Nicholas Mark D and Nicholas Eileen G
Create a Home Valuation Report for This Property
The Home Valuation Report is an in-depth analysis detailing your home's value as well as a comparison with similar homes in the area
Home Values in the Area
Average Home Value in this Area
Purchase History
| Date | Buyer | Sale Price | Title Company |
|---|---|---|---|
| Johnson Kyle Andrew | $445,000 | None Listed On Document | |
| Parker Hugh Randall | $415,000 | -- | |
| Nicholas Mark D | $125,000 | None Available |
Source: Public Records
Mortgage History
| Date | Status | Borrower | Loan Amount |
|---|---|---|---|
| Open | Johnson Kyle Andrew | $378,250 | |
| Previous Owner | Parker Hugh Randall | $332,000 |
Source: Public Records
Tax History Compared to Growth
Tax History
| Year | Tax Paid | Tax Assessment Tax Assessment Total Assessment is a certain percentage of the fair market value that is determined by local assessors to be the total taxable value of land and additions on the property. | Land | Improvement |
|---|---|---|---|---|
| 2025 | $1,055 | $425,395 | $90,000 | $335,395 |
| 2024 | $554 | $134,240 | $65,000 | $69,240 |
| 2023 | $471 | $134,240 | $65,000 | $69,240 |
| 2022 | $458 | $134,240 | $65,000 | $69,240 |
| 2021 | $458 | $134,240 | $65,000 | $69,240 |
| 2020 | $458 | $134,240 | $65,000 | $69,240 |
| 2019 | $441 | $137,328 | $57,000 | $80,328 |
| 2017 | $441 | $137,328 | $57,000 | $80,328 |
| 2016 | $441 | $137,328 | $57,000 | $80,328 |
| 2015 | $427 | $137,328 | $57,000 | $80,328 |
| 2014 | $630 | $204,962 | $123,025 | $81,937 |
Source: Public Records
Map
Nearby Homes
- 1116 E Fort MacOn Rd
- 514 E Fort MacOn Rd
- 106 Willis Ave Unit A
- 115 Island Quay Dr
- 203 Club Colony Dr
- 9 E Fort MacOn Rd
- 105 Winston Ave Unit A&B
- 303 Henderson Blvd Unit 14
- 205 Barefoot Ln
- 204 Winston Ave
- 206 Asbury Ave Unit A
- 301 Commerce Way Rd Unit 101
- 301 Commerce Way Rd Unit 127
- 301 Commerce Way Unit 101
- 301 Commerce Way Unit 258
- 301 Commerce Way Unit 260
- 301 Commerce Way Unit 350 Sea Spray
- 301 Commerce Way Unit 117
- 301 Commerce Way Unit 254
- 301 Commerce Way Unit 223
- 201 Freeman Ln
- 201 Freeman Ln
- 201 Freeman Ln
- 201 Freeman Ln Unit A
- 201 Freeman Ln Unit C
- 201 Freeman Ln Unit B
- 203 Freeman Ln
- 203 Freeman Ln
- 203 Freeman Ln
- 203 Freeman Ln
- 113 Freeman Ln
- 113 Freeman Ln
- 113 Freeman Ln Unit C
- 113 Freeman Ln Unit A
- 113 Freeman Ln Unit B
- 111 Freeman Ln
- 111 Freeman Ln
- 111 Freeman Ln Unit B
- 216 Robin Ave
- 214 Robin Ave