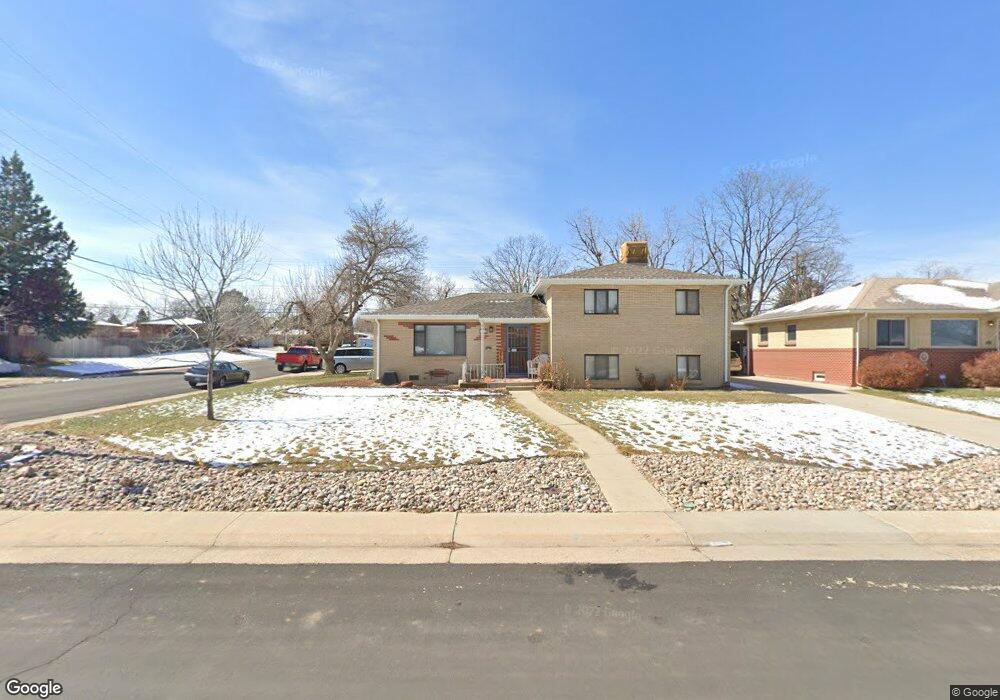
201 Garnet St Broomfield, CO 80020
Broomfield Heights NeighborhoodEstimated Value: $505,000 - $581,000
3
Beds
2
Baths
1,851
Sq Ft
$299/Sq Ft
Est. Value
About This Home
This home is located at 201 Garnet St, Broomfield, CO 80020 and is currently estimated at $552,975, approximately $298 per square foot. 201 Garnet St is a home located in Broomfield County with nearby schools including Broomfield Heights Middle School, Broomfield High School, and Jefferson Academy Secondary School.
Ownership History
Date
Name
Owned For
Owner Type
Purchase Details
Closed on
Apr 12, 2010
Sold by
Marcucci Laurel Lynne
Bought by
Atencio Jeffrey M and Atencio Staci L
Current Estimated Value
Home Financials for this Owner
Home Financials are based on the most recent Mortgage that was taken out on this home.
Original Mortgage
$194,315
Outstanding Balance
$132,585
Interest Rate
5.5%
Mortgage Type
FHA
Estimated Equity
$420,390
Purchase Details
Closed on
Aug 2, 1956
Create a Home Valuation Report for This Property
The Home Valuation Report is an in-depth analysis detailing your home's value as well as a comparison with similar homes in the area
Home Values in the Area
Average Home Value in this Area
Purchase History
| Date | Buyer | Sale Price | Title Company |
|---|---|---|---|
| Atencio Jeffrey M | $197,900 | Land Title Guarantee Company | |
| -- | -- | -- |
Source: Public Records
Mortgage History
| Date | Status | Borrower | Loan Amount |
|---|---|---|---|
| Open | Atencio Jeffrey M | $194,315 |
Source: Public Records
Tax History Compared to Growth
Tax History
| Year | Tax Paid | Tax Assessment Tax Assessment Total Assessment is a certain percentage of the fair market value that is determined by local assessors to be the total taxable value of land and additions on the property. | Land | Improvement |
|---|---|---|---|---|
| 2025 | $3,149 | $34,090 | $9,050 | $25,040 |
| 2024 | $3,149 | $33,610 | $8,150 | $25,460 |
| 2023 | $3,143 | $38,690 | $9,380 | $29,310 |
| 2022 | $2,671 | $27,630 | $6,600 | $21,030 |
| 2021 | $2,657 | $28,420 | $6,790 | $21,630 |
| 2020 | $2,522 | $26,810 | $6,080 | $20,730 |
| 2019 | $2,517 | $27,000 | $6,120 | $20,880 |
| 2018 | $2,122 | $22,480 | $4,570 | $17,910 |
| 2017 | $2,090 | $24,850 | $5,050 | $19,800 |
| 2016 | $1,813 | $19,230 | $5,050 | $14,180 |
| 2015 | $1,751 | $15,270 | $5,050 | $10,220 |
| 2014 | $1,421 | $15,270 | $5,050 | $10,220 |
Source: Public Records
Map
Nearby Homes
- 135 Garnet St
- 216 Hemlock St
- 123 Emerald St
- 920 W 1st Ave
- 690 W 1st Ave
- 55 Emerald St
- 290 Daphne Way
- 375 Hemlock St
- 125 Laurel St
- 255 Beryl Way
- 126 Beryl Way
- 8005 Emerald Ln
- 6801 W 118th Ave
- 400 W Midway Blvd
- 640 Kalmia Way
- 680 Kalmia Way
- 820 W 7th Avenue Dr
- 240 W 6th Ave
- 1 Evergreen St
- 1740 W 6th Ave