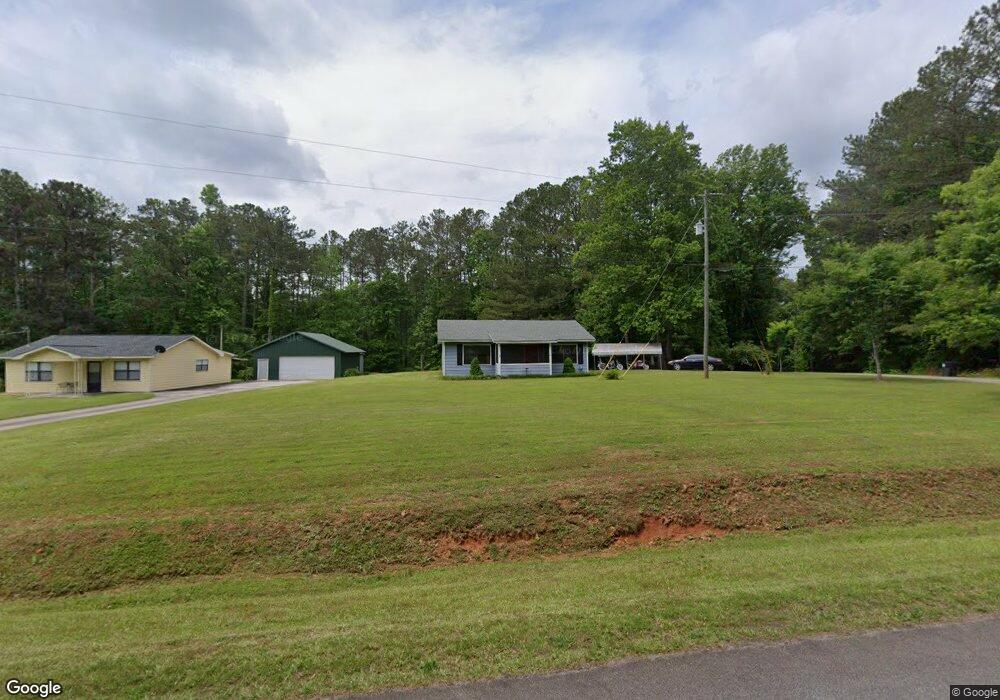
201 Gilley Rd Carrollton, GA 30116
Estimated Value: $164,000 - $200,721
2
Beds
1
Bath
1,008
Sq Ft
$177/Sq Ft
Est. Value
About This Home
This home is located at 201 Gilley Rd, Carrollton, GA 30116 and is currently estimated at $177,930, approximately $176 per square foot. 201 Gilley Rd is a home located in Carroll County with nearby schools including Central Elementary School, Central Middle School, and Central High School.
Ownership History
Date
Name
Owned For
Owner Type
Purchase Details
Closed on
Aug 29, 2016
Sold by
Jack
Bought by
Walker Terry and Walker Mary Louise
Current Estimated Value
Home Financials for this Owner
Home Financials are based on the most recent Mortgage that was taken out on this home.
Original Mortgage
$44,000
Outstanding Balance
$20,385
Interest Rate
3.48%
Mortgage Type
New Conventional
Estimated Equity
$157,545
Purchase Details
Closed on
Jul 21, 2014
Sold by
Henderson Jack
Bought by
Cheek Clinton A
Purchase Details
Closed on
Nov 28, 2012
Sold by
Bierley John
Bought by
Henderson Jack
Purchase Details
Closed on
Jan 1, 2010
Sold by
Bierley John
Bought by
Henderson Jack and Henderson Carolyn V
Purchase Details
Closed on
Dec 29, 2006
Sold by
Not Provided
Bought by
Henderson Jack and Carolyn Henderson V
Purchase Details
Closed on
Dec 17, 2002
Sold by
Henderson Jack
Bought by
Henderson Jack
Purchase Details
Closed on
May 21, 2001
Bought by
Henderson Jack
Create a Home Valuation Report for This Property
The Home Valuation Report is an in-depth analysis detailing your home's value as well as a comparison with similar homes in the area
Home Values in the Area
Average Home Value in this Area
Purchase History
| Date | Buyer | Sale Price | Title Company |
|---|---|---|---|
| Walker Terry | $55,000 | -- | |
| Cheek Clinton A | $50,000 | -- | |
| Henderson Jack | -- | -- | |
| Henderson Jack | -- | -- | |
| Henderson Jack | $56,000 | -- | |
| Henderson Jack | -- | -- | |
| Henderson Jack | -- | -- |
Source: Public Records
Mortgage History
| Date | Status | Borrower | Loan Amount |
|---|---|---|---|
| Open | Walker Terry | $44,000 |
Source: Public Records
Tax History Compared to Growth
Tax History
| Year | Tax Paid | Tax Assessment Tax Assessment Total Assessment is a certain percentage of the fair market value that is determined by local assessors to be the total taxable value of land and additions on the property. | Land | Improvement |
|---|---|---|---|---|
| 2024 | $1,195 | $52,825 | $6,713 | $46,112 |
| 2023 | $1,195 | $48,134 | $5,370 | $42,764 |
| 2022 | $951 | $37,922 | $3,580 | $34,342 |
| 2021 | $855 | $33,362 | $2,864 | $30,498 |
| 2020 | $751 | $29,246 | $2,604 | $26,642 |
| 2019 | $710 | $27,445 | $2,604 | $24,841 |
| 2018 | $668 | $25,438 | $2,434 | $23,004 |
| 2017 | $533 | $25,438 | $2,434 | $23,004 |
| 2016 | $118 | $25,516 | $2,512 | $23,004 |
| 2015 | $119 | $22,128 | $3,593 | $18,536 |
| 2014 | $467 | $37,921 | $7,916 | $30,006 |
Source: Public Records
Map
Nearby Homes
- 0 Bankhead Hwy and Sassafras Unit 140936
- 52 Castleman Rd
- 2181 2201 Star Point
- 252 Mink Hollow Dr
- 200 Heath Rd
- 0 Cross Plains Rd Unit 10644288
- 0 Cross Plains Rd Unit 7682594
- 2033 Old Newnan Rd
- 00 Heath Rd
- 0 Heath Rd Unit 20173471
- 391 Foggy Bottom Dr
- 2218 Cross Plains Hulett Rd
- 2800 Georgia 16
- 2800 Sr 16
- 158 Foggy Bottom Dr
- 2716 Georgia 16
- 357 Old Driver Rd
- 0 Clem Lowell Rd Unit 10479926
- 0 Clem Lowell Rd Unit 147578
- 0 Clem Lowell Rd Unit 7630669