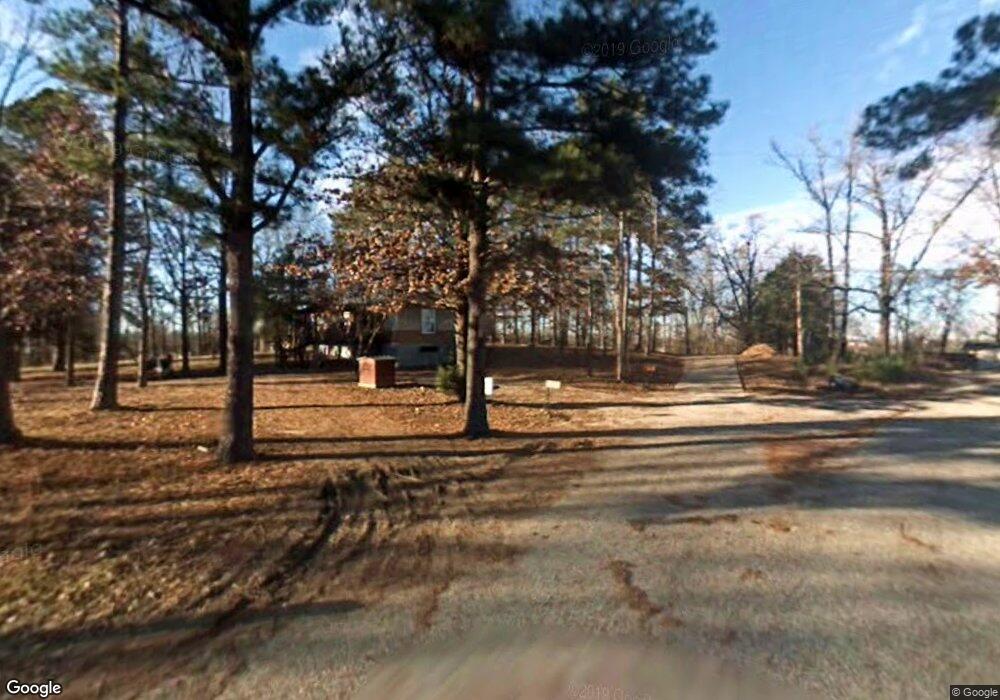
201 Graves Trail Pearcy, AR 71964
Estimated Value: $325,000 - $410,000
3
Beds
2
Baths
2,517
Sq Ft
$146/Sq Ft
Est. Value
About This Home
This home is located at 201 Graves Trail, Pearcy, AR 71964 and is currently estimated at $366,878, approximately $145 per square foot. 201 Graves Trail is a home located in Garland County with nearby schools including Lake Hamilton Primary School, Lake Hamilton Interm. School, and Lake Hamilton Elementary School.
Ownership History
Date
Name
Owned For
Owner Type
Purchase Details
Closed on
Apr 4, 2008
Sold by
Pattyn Eanest
Bought by
Pattyn Emest
Current Estimated Value
Purchase Details
Closed on
Jan 28, 2005
Sold by
Pattyn Ernest
Bought by
Pattyn Ernest and Ernest Pattyn Trust
Purchase Details
Closed on
Apr 4, 2000
Sold by
Not Provided
Bought by
Pattyn Ernie
Purchase Details
Closed on
Jan 20, 2000
Sold by
Not Provided
Bought by
Sec Of Housing & Urban
Purchase Details
Closed on
Dec 20, 1999
Sold by
Not Provided
Bought by
Norwest Mortgage Inc
Purchase Details
Closed on
Oct 27, 1997
Sold by
Not Provided
Bought by
Parker Paula Renae
Purchase Details
Closed on
Feb 14, 1995
Sold by
Not Provided
Bought by
Wacaster James A and Wacaster Earlene
Create a Home Valuation Report for This Property
The Home Valuation Report is an in-depth analysis detailing your home's value as well as a comparison with similar homes in the area
Home Values in the Area
Average Home Value in this Area
Purchase History
| Date | Buyer | Sale Price | Title Company |
|---|---|---|---|
| Pattyn Emest | -- | None Available | |
| Pattyn Ernest | -- | None Available | |
| Pattyn Ernie | -- | -- | |
| Sec Of Housing & Urban | -- | -- | |
| Norwest Mortgage Inc | -- | -- | |
| Parker Paula Renae | $64,000 | -- | |
| Wacaster James A | $9,000 | -- |
Source: Public Records
Tax History Compared to Growth
Tax History
| Year | Tax Paid | Tax Assessment Tax Assessment Total Assessment is a certain percentage of the fair market value that is determined by local assessors to be the total taxable value of land and additions on the property. | Land | Improvement |
|---|---|---|---|---|
| 2025 | $1,909 | $69,390 | $7,460 | $61,930 |
| 2024 | $1,877 | $69,390 | $7,460 | $61,930 |
| 2023 | $1,855 | $69,390 | $7,460 | $61,930 |
| 2022 | $2,257 | $69,390 | $7,460 | $61,930 |
| 2021 | $2,036 | $44,700 | $4,540 | $40,160 |
| 2020 | $1,661 | $44,700 | $4,540 | $40,160 |
| 2019 | $1,601 | $44,700 | $4,540 | $40,160 |
| 2018 | $1,601 | $44,700 | $4,540 | $40,160 |
| 2017 | $1,606 | $44,700 | $4,540 | $40,160 |
| 2016 | $1,439 | $40,470 | $5,640 | $34,830 |
| 2015 | $1,407 | $40,470 | $5,640 | $34,830 |
| 2014 | $1,333 | $38,097 | $3,267 | $34,830 |
Source: Public Records
Map
Nearby Homes
- 124 Primrose Ln
- 162 Ridgehaven Dr
- 222 D & M Ct
- 408 Adam Brown Rd
- 10 Fieldstone Pass
- 4903 Sunshine Rd
- 4907 Sunshine Rd
- 101 Songer
- 5701 Sunshine Rd Unit B
- 5701 B Sunshine Rd
- 480 Shoat
- 196 Jackson Manor Ct
- 148 Lost Creek Rd
- 3370 Airport Rd
- TBD Music Dr
- 3249 Timberlake
- 000 Evan Way
- 202 Starfield Place
- 113 Breckenridge Terrace
- 322 Forestcreek Rd
- 204 Graves Trail Unit A
- XXX Graves
- 200 Graves
- 164 Graves Trail
- LOTS 5 & 6 Graves Trail
- 6.33 Acres Graves Trail
- 209 Dusty Ln
- 408 Brunswick Dr
- 203 Dusty Ln
- 310 Brunswick Dr
- 249 Brunswick Dr
- 132 Little Joe Trail
- 000 Brunswick Dr
- 210 Dusty Ln
- 164 Little Joe Trail
- 215 Brunswick Dr
- 625 Whitfield Rd
- 0 Dusty Ln
- 4190 Airport Rd
- 159 Dusty Ln