D
Landlord's Agent in 2024
Debbie Porth
Carolinas Signature Property Management LLC
(704) 965-4591
4 Total Sales
Estimated Value: $289,207 - $308,000
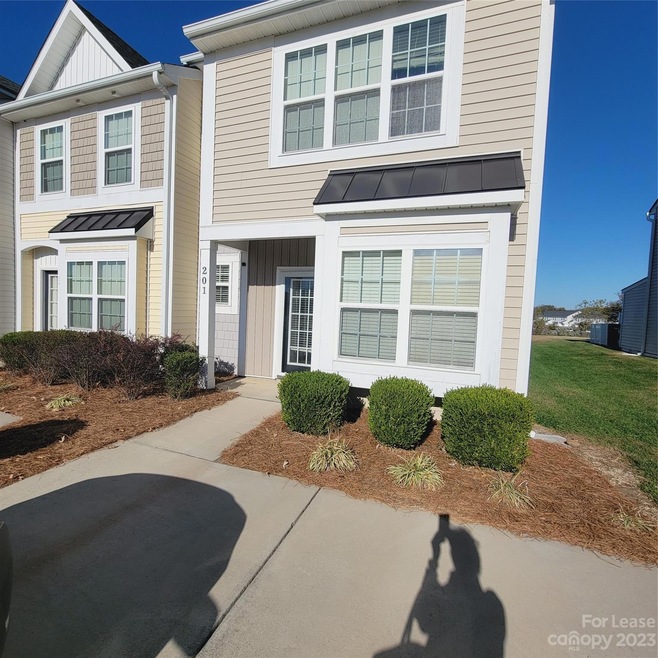
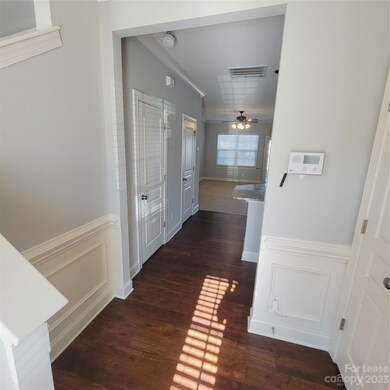
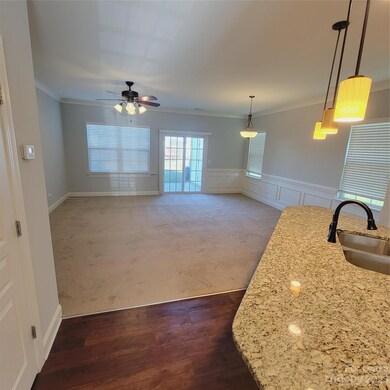
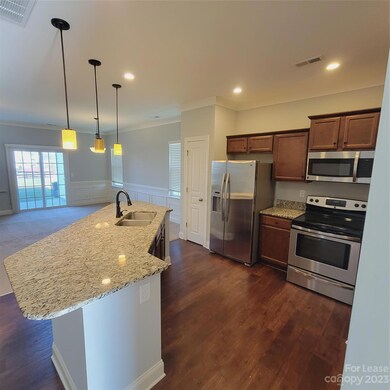
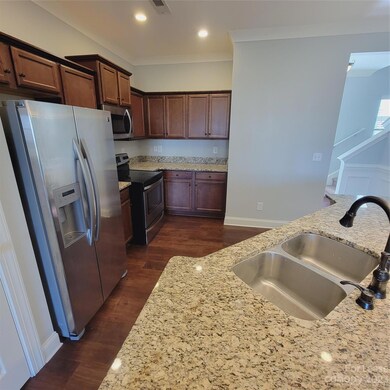
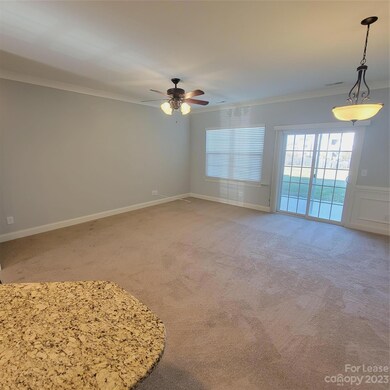
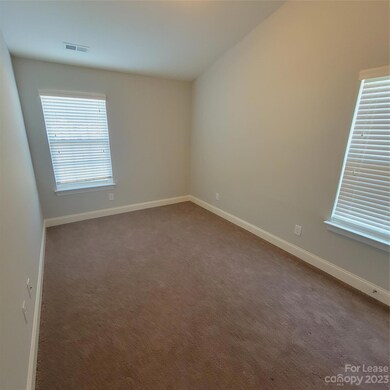
Welcome to 201 Halton Crossing Drive Southwest, your new home in Concord, NC! This spacious 3-bedroom townhouse offers a comfortable and inviting living space. Step inside to discover new carpet on main level, creating a fresh and cozy atmosphere. The property boasts an office or study area, perfect for those who work or study from home. The kitchen features beautiful granite countertops, ideal for meal preparation and entertaining guests. Enjoy the outdoors on the patio, a great spot for relaxation or hosting gatherings. The large living and dining areas make for effortless entertaining and family time.With an open floor concept and ample parking, this townhouse provides convenience and ease of living.Ready for immediate occupancy! No Smoking. No Assistance Programs. $75/adult application fee.A Resident Benefits Package of $40.95/per month is required;$125 lease prep fee;pets are conditional with a non-refundable pet fee and a $20/month pet fee.
Last Agent to Rent the Property
Carolinas Signature Property Management LLC Brokerage Email: debbie@carolinassignature.com License #232049 Listed on: 11/02/2023
Last Renter's Agent
Carolinas Signature Property Management LLC License #256388
| Date | Buyer | Sale Price | Title Company |
|---|---|---|---|
| Mekala Venkata Ramana | $234,000 | Chicago Title Insurance Co | |
| Opendoor Property Trust 1 | $219,000 | Chicago Title Insurance Co | |
| Richardson Angela D | $140,000 | None Available |
| Date | Status | Borrower | Loan Amount |
|---|---|---|---|
| Open | Mekala Venkata Ramana | $180,000 | |
| Previous Owner | Richardson Angela D | $142,000 |
| Date | Event | Price | List to Sale | Price per Sq Ft | Prior Sale |
|---|---|---|---|---|---|
| 01/08/2024 01/08/24 | Rented | $1,695 | 0.0% | -- | |
| 12/29/2023 12/29/23 | Price Changed | $1,695 | -2.9% | $1 / Sq Ft | |
| 12/12/2023 12/12/23 | Price Changed | $1,745 | -3.1% | $1 / Sq Ft | |
| 11/20/2023 11/20/23 | Price Changed | $1,800 | -5.0% | $1 / Sq Ft | |
| 11/02/2023 11/02/23 | For Rent | $1,895 | 0.0% | -- | |
| 05/21/2021 05/21/21 | Sold | $234,000 | -6.4% | $147 / Sq Ft | View Prior Sale |
| 04/15/2021 04/15/21 | Pending | -- | -- | -- | |
| 04/13/2021 04/13/21 | For Sale | $250,000 | 0.0% | $157 / Sq Ft | |
| 04/08/2021 04/08/21 | Pending | -- | -- | -- | |
| 04/05/2021 04/05/21 | For Sale | $250,000 | -- | $157 / Sq Ft |
| Year | Tax Paid | Tax Assessment Tax Assessment Total Assessment is a certain percentage of the fair market value that is determined by local assessors to be the total taxable value of land and additions on the property. | Land | Improvement |
|---|---|---|---|---|
| 2025 | $2,836 | $284,770 | $60,000 | $224,770 |
| 2024 | $2,836 | $284,770 | $60,000 | $224,770 |
| 2023 | $2,245 | $184,000 | $50,000 | $134,000 |
| 2022 | $2,245 | $184,000 | $50,000 | $134,000 |
| 2021 | $2,245 | $184,000 | $50,000 | $134,000 |
| 2020 | $2,245 | $184,000 | $50,000 | $134,000 |
| 2019 | $1,750 | $143,430 | $25,000 | $118,430 |
| 2018 | $1,721 | $143,430 | $25,000 | $118,430 |
| 2017 | $1,692 | $143,430 | $25,000 | $118,430 |
| 2016 | $1,004 | $129,180 | $25,000 | $104,180 |
| 2015 | -- | $25,000 | $25,000 | $0 |
| 2014 | -- | $25,000 | $25,000 | $0 |
D
Landlord's Agent in 2024
Debbie Porth
Carolinas Signature Property Management LLC
(704) 965-4591
4 Total Sales

Tenant's Agent in 2024
Kandi Autry- Reynolds
Carolinas Signature Property Management LLC
(980) 209-9745
5 Total Sales
V
Seller's Agent in 2021
Verria Hairston
Opendoor Brokerage LLC
N
Buyer's Agent in 2021
Naresh Yerram
Red Bricks Realty LLC
Source: Canopy MLS (Canopy Realtor® Association)
MLS Number: 4084336
APN: 5509-43-9021-0000
Disclaimer: Certain information contained herein is derived from information provided by parties other than Homes.com. All information provided is deemed reliable, but is not guaranteed to be accurate and should be independently verified.
![]() Based on information submitted to the MLS GRID. All data is obtained from various sources and may not have been verified by broker or MLS GRID. Supplied Open House Information is subject to change without notice. All information should be independently reviewed and verified for accuracy. Properties may or may not be listed by the office/agent presenting the information. Some IDX listings have been excluded from this website.
Based on information submitted to the MLS GRID. All data is obtained from various sources and may not have been verified by broker or MLS GRID. Supplied Open House Information is subject to change without notice. All information should be independently reviewed and verified for accuracy. Properties may or may not be listed by the office/agent presenting the information. Some IDX listings have been excluded from this website.
The Digital Millennium Copyright Act of 1998, 17 U.S.C. § 512 (the “DMCA”) provides recourse for copyright owners who believe that material appearing on the Internet infringes their rights under U.S. copyright law. If you believe in good faith that any content or material made available in connection with our website or services infringes your copyright, you (or your agent) may send us a notice requesting that the content or material be removed, or access to it blocked.
Notices must be sent in writing by email to DMCAnotice@MLSGrid.com.
The DMCA requires that your notice of alleged copyright infringement include the following information:
(1) description of the copyrighted work that is the subject of claimed infringement;
(2) description of the alleged infringing content and information sufficient to permit us to locate the content;
(3) contact information for you, including your address, telephone number and email address;
(4) a statement by you that you have a good faith belief that the content in the manner complained of is not authorized by the copyright owner, or its agent, or by the operation of any law;
(5) a statement by you, signed under penalty of perjury, that the information in the notification is accurate and that you have the authority to enforce the copyrights that are claimed to be infringed; and
(6) a physical or electronic signature of the copyright owner or a person authorized to act on the copyright owner’s behalf. Failure to include all of the above information may result in the delay of the processing of your complaint.