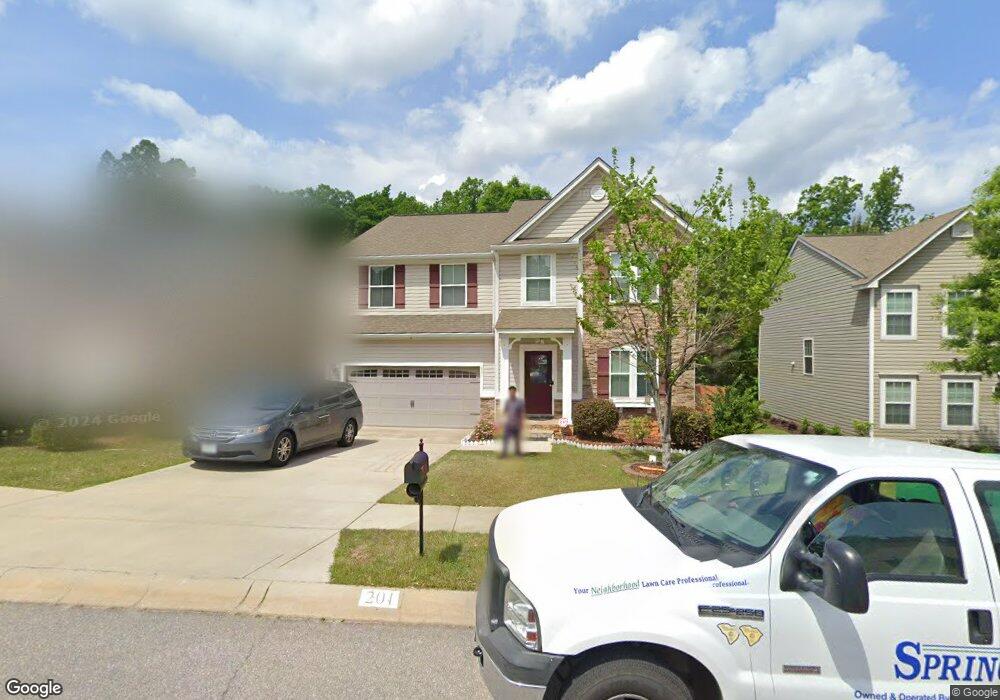
201 Hammock Dr Lexington, SC 29072
Estimated Value: $268,000 - $451,000
4
Beds
3
Baths
2,880
Sq Ft
$126/Sq Ft
Est. Value
About This Home
This home is located at 201 Hammock Dr, Lexington, SC 29072 and is currently estimated at $362,866, approximately $125 per square foot. 201 Hammock Dr is a home located in Lexington County with nearby schools including Midway Elementary School, River Bluff High School, and American Leadership Academy South Carolina-Lexington Campus.
Ownership History
Date
Name
Owned For
Owner Type
Purchase Details
Closed on
Jul 8, 2020
Sold by
Mortha Satish K
Bought by
Mortha Satish K and Sundararajan Baanu Priya
Current Estimated Value
Purchase Details
Closed on
Oct 22, 2009
Sold by
Nvr Inc
Bought by
Mortha Satish K
Home Financials for this Owner
Home Financials are based on the most recent Mortgage that was taken out on this home.
Original Mortgage
$179,498
Outstanding Balance
$116,910
Interest Rate
5.03%
Mortgage Type
FHA
Estimated Equity
$245,956
Purchase Details
Closed on
Jul 21, 2009
Sold by
Atlantis Development Group Llc
Bought by
Nvr Inc
Create a Home Valuation Report for This Property
The Home Valuation Report is an in-depth analysis detailing your home's value as well as a comparison with similar homes in the area
Home Values in the Area
Average Home Value in this Area
Purchase History
| Date | Buyer | Sale Price | Title Company |
|---|---|---|---|
| Mortha Satish K | -- | None Available | |
| Mortha Satish K | $182,810 | -- | |
| Nvr Inc | $102,000 | -- | |
| Atlantis Development Group Llc | $18,000 | -- |
Source: Public Records
Mortgage History
| Date | Status | Borrower | Loan Amount |
|---|---|---|---|
| Open | Mortha Satish K | $179,498 |
Source: Public Records
Tax History
| Year | Tax Paid | Tax Assessment Tax Assessment Total Assessment is a certain percentage of the fair market value that is determined by local assessors to be the total taxable value of land and additions on the property. | Land | Improvement |
|---|---|---|---|---|
| 2024 | $7,759 | $9,215 | $1,400 | $7,815 |
| 2023 | $1,617 | $9,215 | $1,400 | $7,815 |
| 2022 | $1,613 | $9,215 | $1,400 | $7,815 |
| 2020 | $1,649 | $9,215 | $1,400 | $7,815 |
| 2019 | $1,510 | $7,961 | $1,200 | $6,761 |
| 2018 | $1,487 | $7,961 | $1,200 | $6,761 |
| 2017 | $1,451 | $7,961 | $1,200 | $6,761 |
| 2016 | $1,440 | $7,961 | $1,200 | $6,761 |
| 2014 | $1,282 | $7,311 | $1,480 | $5,831 |
| 2013 | -- | $7,310 | $1,480 | $5,830 |
Source: Public Records
Map
Nearby Homes
- 1443 Trailhead Ln
- 1442 Trailhead Ln
- 437 Forest Edge Trail
- 445 Forest Edge Trail
- 416 Forest Edge Trail
- 473 Forest Edge Trail
- 485 Forest Edge Trail
- 488 Forest Edge Trail
- 105 Ashley Ct
- 116 Landing Dr
- 1802 Laryn Ln
- 1504 Laryn Ln
- 101 E Sparrowood Run
- 109 E Sparrowood Run
- 1302 Laryn Ln
- 628 Whitland Rd
- 504 Ashdown Park Ct
- 113 Huntington Cir
- 100 Mallard Lakes Ct
- 409 Ivy Green Ln
- 203 Hammock Dr
- 147 Hammock Dr
- 205 Hammock Dr
- 145 Hammock Dr
- 207 Hammock Dr
- 143 Hammock Dr
- 200 Appalachian Trail
- 202 Hammock Dr
- 200 Hammock Dr
- 209 Hammock Dr
- 204 Hammock Dr
- 204 Hammock Dr Unit 16
- 141 Hammock Dr
- 116 Appalachian Trail
- 202 Appalachian Trail
- 206 Hammock Dr
- 144 Hammock Dr
- 211 Hammock Dr
- 112 Appalachian Trail
- 139 Hammock Dr
Your Personal Tour Guide
Ask me questions while you tour the home.