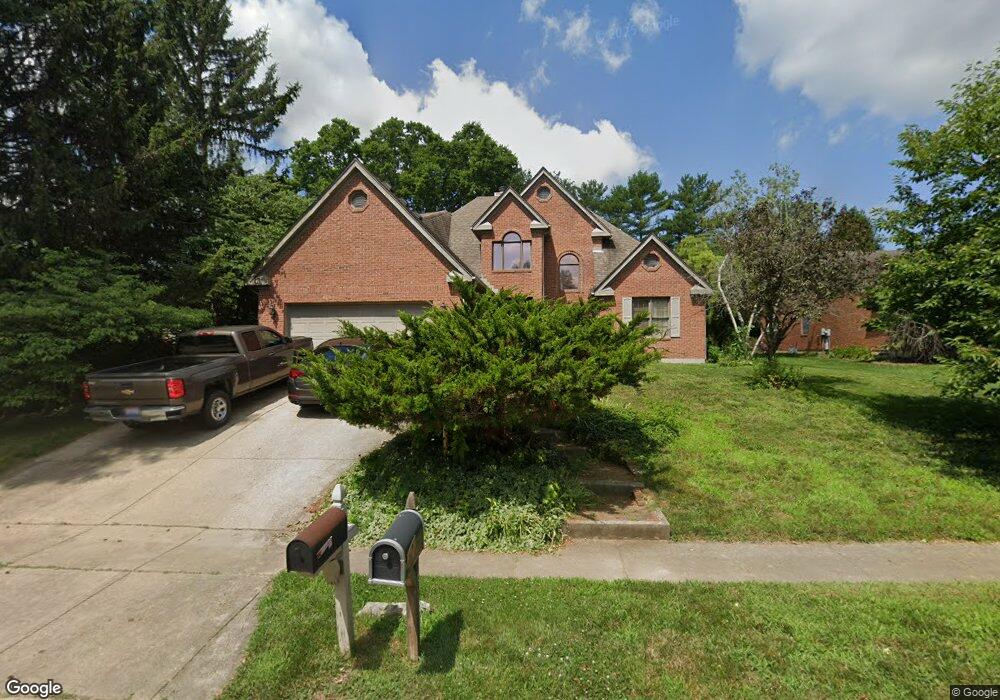
201 Hemlock St Franklin, OH 45005
Estimated Value: $395,128 - $447,000
3
Beds
3
Baths
2,664
Sq Ft
$156/Sq Ft
Est. Value
About This Home
This home is located at 201 Hemlock St, Franklin, OH 45005 and is currently estimated at $415,532, approximately $155 per square foot. 201 Hemlock St is a home located in Warren County with nearby schools including Franklin High School and The CinDay Academy.
Ownership History
Date
Name
Owned For
Owner Type
Purchase Details
Closed on
Sep 17, 2013
Sold by
Mcguire Linda L and Coll Linda L
Bought by
Mcguire Jay G
Current Estimated Value
Purchase Details
Closed on
May 27, 1998
Sold by
Mccarty Bruce A
Bought by
Mcguire Linda L and Mcguire Jay G
Home Financials for this Owner
Home Financials are based on the most recent Mortgage that was taken out on this home.
Original Mortgage
$164,800
Outstanding Balance
$28,931
Interest Rate
7.27%
Mortgage Type
New Conventional
Estimated Equity
$386,602
Purchase Details
Closed on
Jul 22, 1994
Sold by
Henderson R Todd
Bought by
Mccarty Bruce A and Mccarty Cheryl A
Create a Home Valuation Report for This Property
The Home Valuation Report is an in-depth analysis detailing your home's value as well as a comparison with similar homes in the area
Home Values in the Area
Average Home Value in this Area
Purchase History
We collect this data history from publicly available records. To have your information removed, we recommend requesting removal directly through your county’s website.
| Date | Buyer | Sale Price | Title Company |
|---|---|---|---|
| Mcguire Jay G | -- | None Available | |
| Mcguire Linda L | $206,000 | -- | |
| Mccarty Bruce A | $30,000 | -- |
Source: Public Records
Mortgage History
We collect this data history from publicly available records. To have your information removed, we recommend requesting removal directly through your county’s website.
| Date | Status | Borrower | Loan Amount |
|---|---|---|---|
| Open | Mcguire Linda L | $164,800 |
Source: Public Records
Tax History
| Year | Tax Paid | Tax Assessment Tax Assessment Total Assessment is a certain percentage of the fair market value that is determined by local assessors to be the total taxable value of land and additions on the property. | Land | Improvement |
|---|---|---|---|---|
| 2025 | $5,299 | $122,290 | $24,500 | $97,790 |
| 2024 | $5,299 | $122,290 | $24,500 | $97,790 |
| 2023 | $4,759 | $99,365 | $12,915 | $86,450 |
| 2022 | $5,112 | $99,365 | $12,915 | $86,450 |
| 2021 | $4,847 | $99,365 | $12,915 | $86,450 |
| 2020 | $4,467 | $80,784 | $10,500 | $70,284 |
| 2019 | $4,063 | $80,784 | $10,500 | $70,284 |
| 2018 | $4,070 | $80,784 | $10,500 | $70,284 |
| 2017 | $3,738 | $67,876 | $9,041 | $58,835 |
| 2016 | $3,810 | $67,876 | $9,041 | $58,835 |
| 2015 | $3,810 | $67,876 | $9,041 | $58,835 |
| 2014 | $3,793 | $65,900 | $8,780 | $57,120 |
| 2013 | $3,217 | $78,830 | $10,500 | $68,330 |
Source: Public Records
Map
Nearby Homes
- 81 Argile Ct
- 700 Arlington Ave
- 103 Mound Builder Place
- 334 Harpwood Dr
- 23 Holly Dr
- 51 Ruppert Ct
- 67 Millard Dr
- 155 Arlington Ave
- 551 E 2nd St
- 8205 Westlawn Dr
- 811 Victoria Dr
- 747 David Blvd
- 99 Arlington Ave
- 0 Victoria Dr Unit 942075
- 0 Victoria Dr Unit 1852824
- 760 David Blvd
- 926 Michaels Dr
- 517 Millard Ct
- 110 S River St
- 202 E 2nd St
Your Personal Tour Guide
Ask me questions while you tour the home.