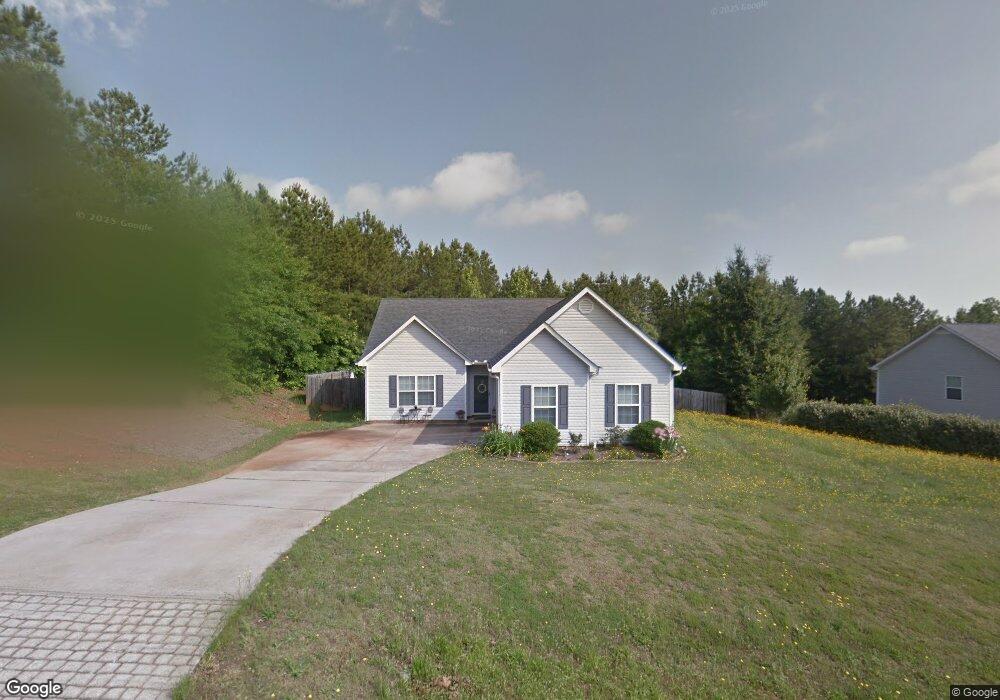
201 Hickory Rd Jackson, GA 30233
Estimated Value: $240,288 - $254,000
3
Beds
2
Baths
1,224
Sq Ft
$204/Sq Ft
Est. Value
About This Home
This home is located at 201 Hickory Rd, Jackson, GA 30233 and is currently estimated at $249,572, approximately $203 per square foot. 201 Hickory Rd is a home located in Monroe County with nearby schools including Samuel E. Hubbard Elementary School and Mary Persons High School.
Ownership History
Date
Name
Owned For
Owner Type
Purchase Details
Closed on
Jul 15, 2022
Sold by
Daly Tammy Lavonne
Bought by
Daly Tammy Lavonne and Harvey Mary Leann
Current Estimated Value
Purchase Details
Closed on
Nov 24, 2020
Sold by
Blackburn Justin T
Bought by
Daly Tammy Lavonne
Home Financials for this Owner
Home Financials are based on the most recent Mortgage that was taken out on this home.
Original Mortgage
$157,575
Interest Rate
2.8%
Mortgage Type
New Conventional
Purchase Details
Closed on
May 20, 2013
Sold by
Blackburn Justin T
Bought by
Blackburn Justin T and Blackburn Jessica L
Purchase Details
Closed on
May 19, 2005
Sold by
The Everwood Grp Llp
Bought by
Blackburn Justin T and Latourette Jessica L
Home Financials for this Owner
Home Financials are based on the most recent Mortgage that was taken out on this home.
Original Mortgage
$105,119
Interest Rate
5.74%
Mortgage Type
FHA
Purchase Details
Closed on
Feb 11, 2004
Sold by
Housing Resources Unlimited Inc And Lest
Bought by
The Everwood Group Llc
Purchase Details
Closed on
Sep 12, 2002
Sold by
Middle Georgia Land And Timber Corporati
Bought by
Housing Resources Unlimited Inc And Lest
Create a Home Valuation Report for This Property
The Home Valuation Report is an in-depth analysis detailing your home's value as well as a comparison with similar homes in the area
Home Values in the Area
Average Home Value in this Area
Purchase History
| Date | Buyer | Sale Price | Title Company |
|---|---|---|---|
| Daly Tammy Lavonne | -- | -- | |
| Daly Tammy Lavonne | $156,000 | -- | |
| Blackburn Justin T | -- | -- | |
| Blackburn Justin T | $106,000 | -- | |
| The Everwood Group Llc | $645,000 | -- | |
| Housing Resources Unlimited Inc And Lest | $546,000 | -- |
Source: Public Records
Mortgage History
| Date | Status | Borrower | Loan Amount |
|---|---|---|---|
| Previous Owner | Daly Tammy Lavonne | $157,575 | |
| Previous Owner | Blackburn Justin T | $105,119 |
Source: Public Records
Tax History
| Year | Tax Paid | Tax Assessment Tax Assessment Total Assessment is a certain percentage of the fair market value that is determined by local assessors to be the total taxable value of land and additions on the property. | Land | Improvement |
|---|---|---|---|---|
| 2025 | $1,790 | $75,600 | $12,000 | $63,600 |
| 2024 | $1,790 | $75,600 | $12,000 | $63,600 |
| 2023 | $1,718 | $62,880 | $12,000 | $50,880 |
| 2022 | $1,378 | $62,880 | $12,000 | $50,880 |
| 2021 | $1,192 | $54,520 | $10,000 | $44,520 |
| 2020 | $999 | $46,760 | $10,000 | $36,760 |
| 2019 | $891 | $42,760 | $10,000 | $32,760 |
| 2018 | $893 | $42,760 | $10,000 | $32,760 |
| 2017 | $1,099 | $37,800 | $4,000 | $33,800 |
| 2016 | $713 | $37,800 | $4,000 | $33,800 |
| 2015 | $676 | $37,800 | $4,000 | $33,800 |
| 2014 | $653 | $37,800 | $4,000 | $33,800 |
Source: Public Records
Map
Nearby Homes
- 202 Hickory Rd
- 89 Springdale Rd
- 196 Horseshoe Bend Rd
- 15 Shady Ln
- 43 Shady Ln
- 450 Lakeshore Dr
- 122 Lakeside Cir
- 119 Willow Way
- 260 Brushy Creek Cir
- 4687 Boxankle Rd
- 198 Antony Dr
- 96 Pointe View Ct
- 65 Pointe View Ct
- 546 Harbour Shores Dr
- 475 Harbour Shores Dr
- 240 Riverview Rd
- 150 Dogwood Ct
- 644 Harbour Shores Dr
- 191 Big Buck Trail
- 370 Harbour Shores Dr
Your Personal Tour Guide
Ask me questions while you tour the home.