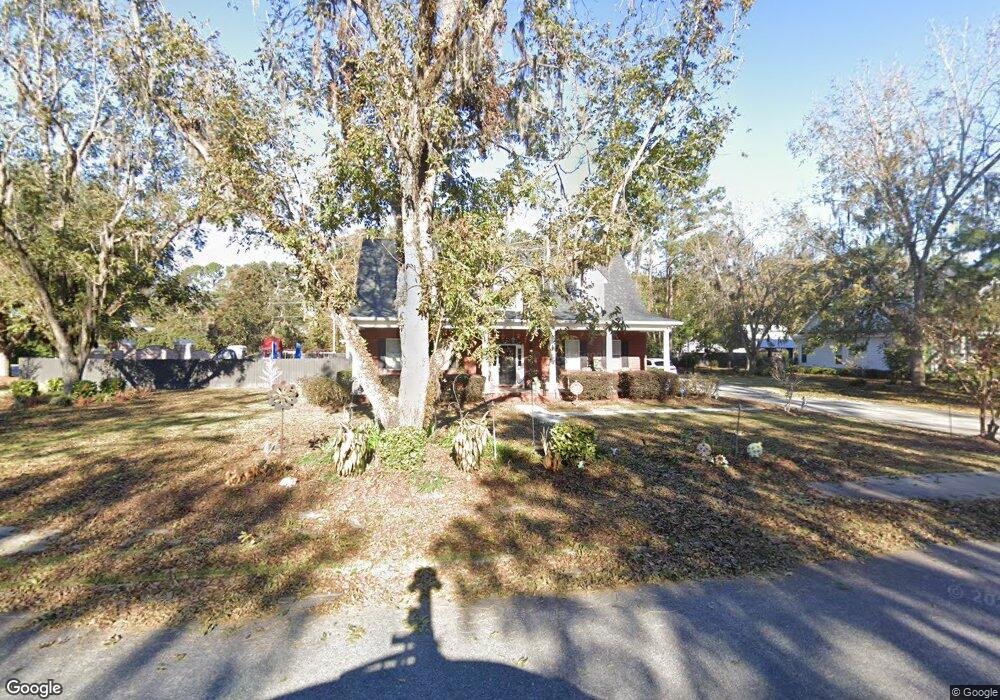
201 Hubener Dr Rincon, GA 31326
Estimated Value: $547,000 - $697,000
4
Beds
4
Baths
3,517
Sq Ft
$176/Sq Ft
Est. Value
About This Home
This home is located at 201 Hubener Dr, Rincon, GA 31326 and is currently estimated at $618,331, approximately $175 per square foot. 201 Hubener Dr is a home located in Effingham County with nearby schools including South Effingham Elementary School, South Effingham Middle School, and South Effingham High School.
Ownership History
Date
Name
Owned For
Owner Type
Purchase Details
Closed on
Apr 22, 2011
Sold by
Geary Robert J
Bought by
Geary Robert J and Christian Cheryl H
Current Estimated Value
Home Financials for this Owner
Home Financials are based on the most recent Mortgage that was taken out on this home.
Original Mortgage
$265,168
Outstanding Balance
$181,707
Interest Rate
4.81%
Mortgage Type
VA
Estimated Equity
$436,624
Purchase Details
Closed on
Apr 21, 2011
Sold by
Fannie Mae
Bought by
Geary Robert J
Home Financials for this Owner
Home Financials are based on the most recent Mortgage that was taken out on this home.
Original Mortgage
$265,168
Outstanding Balance
$181,707
Interest Rate
4.81%
Mortgage Type
VA
Estimated Equity
$436,624
Purchase Details
Closed on
Oct 5, 2010
Sold by
Galletta Paul V
Bought by
Federal National Mortgage Association
Purchase Details
Closed on
May 27, 2005
Sold by
Galletta V Paul
Bought by
Galletta V Paul and Duggar Paula Jean
Home Financials for this Owner
Home Financials are based on the most recent Mortgage that was taken out on this home.
Original Mortgage
$256,500
Interest Rate
5.63%
Mortgage Type
New Conventional
Create a Home Valuation Report for This Property
The Home Valuation Report is an in-depth analysis detailing your home's value as well as a comparison with similar homes in the area
Home Values in the Area
Average Home Value in this Area
Purchase History
| Date | Buyer | Sale Price | Title Company |
|---|---|---|---|
| Geary Robert J | -- | -- | |
| Geary Robert J | $275,000 | -- | |
| Federal National Mortgage Association | $237,400 | -- | |
| Galletta V Paul | -- | -- | |
| Galletta V Paul | $285,000 | -- |
Source: Public Records
Mortgage History
| Date | Status | Borrower | Loan Amount |
|---|---|---|---|
| Open | Geary Robert J | $265,168 | |
| Closed | Geary Robert J | $265,168 | |
| Previous Owner | Galletta V Paul | $256,500 |
Source: Public Records
Tax History Compared to Growth
Tax History
| Year | Tax Paid | Tax Assessment Tax Assessment Total Assessment is a certain percentage of the fair market value that is determined by local assessors to be the total taxable value of land and additions on the property. | Land | Improvement |
|---|---|---|---|---|
| 2025 | $5,121 | $204,405 | $30,000 | $174,405 |
| 2024 | $5,121 | $238,031 | $30,000 | $208,031 |
| 2023 | $3,991 | $184,616 | $22,800 | $161,816 |
| 2022 | $4,633 | $183,016 | $21,200 | $161,816 |
| 2021 | $3,470 | $169,850 | $21,200 | $148,650 |
| 2020 | $3,412 | $175,328 | $21,200 | $154,128 |
| 2019 | $3,332 | $168,497 | $21,200 | $147,297 |
| 2018 | $3,289 | $131,667 | $21,200 | $110,467 |
| 2017 | $3,322 | $131,667 | $21,200 | $110,467 |
| 2016 | $3,171 | $112,612 | $21,200 | $91,412 |
| 2015 | -- | $105,412 | $14,000 | $91,412 |
| 2014 | -- | $105,412 | $14,000 | $91,412 |
| 2013 | -- | $116,927 | $8,000 | $108,927 |
Source: Public Records
Map
Nearby Homes
- 213 English Oak Dr
- 129 Fraser Ln
- 139 Fraser Ln
- 134 Fraser Ln
- 141 Fraser Ln
- 135 Fraser Ln
- 127 Fraser Ln
- 114 Fraser Ln
- 103 Monterey Dr
- 101 Monterey Dr
- 126 Fraser Ln
- 433 Exley Loop
- 143 Summer Station Dr
- 0 Huger St Unit SA338762
- 416 Moss Loop
- 165 Jennifer Cir
- 0 Hodgeville Rd Unit SA341541
- 0 Hodgeville Rd Unit 10622997
- 124 Oak St
- 127 Crystal Dr
- 203 Hubener Dr
- 100 Gordon B Hinckley Ave
- 204 Hubener Dr
- 200 Hubener Dr
- 100 Autumn Dr
- 102 Gordon B Hinckley Ave
- 205 Hubener Dr
- 102 Autumn Dr
- 206 Hubener Dr
- 104 Gordon B Hinckley Ave
- 207 Hubener Dr
- 107 Gordon B Hinckley Ave
- 105 Gordon B Hinckley Ave
- 101 Autumn Dr
- 101 Autumn Dr Unit 1
- 208 Hubener Dr
- 104 Autumn Dr
- 109 Gordon B Hinckley Ave
- 106 Gordon B Hinckley Ave
- 103 Autumn Dr